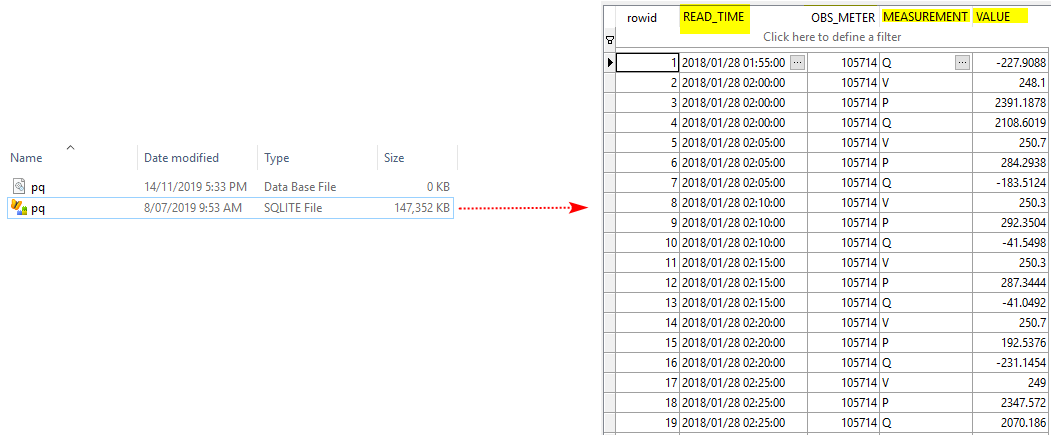
I am trying to plot time series data by accessing the SQLite database. I successfully connect the database by coding the below script,however, i couldn't figure out how to plot the time series data from .sqlite file.
import sqlite3
from sqlite3 import Error


def create_connection(db_file):
    """ create a database connection to the SQLite database
        specified by the db_file
    :param db_file: database file
    :return: Connection object or None
    """
    conn = None
    try:
        conn = sqlite3.connect(db_file)
    except Error as e:
        print(e)

    return conn

def main():
    database = r"E:\Data\SINCAL_Models\AusNetData\20180128_PQV\pq.sqlite"

    # create a database connection
    conn = create_connection(database)
    with conn:
        print("Database connected:")

if __name__ == '__main__':
    main()
The database file is shown in attached picture. I am trying to plot the yellow highlighted variables to get the plot like here

