10
$\begingroup$

For a recommendation system I'm using cosine similarity to compute similarities between items. However, for items with small amounts of data I'd like to bin them under a general "average" category (in the general not mathematical sense). To accomplish this I'm currently trying to create a synthetic observation to represent that middle of the road point.

So for example if these were my observations (rows are observations, cols are features):

[[0, 0, 0, 1, 1, 1, 0, 1, 0],
 [1, 0, 1, 0, 0, 0, 1, 0, 0],
 [1, 1, 1, 1, 0, 1, 0, 1, 1],
 [0, 0, 1, 0, 0, 1, 0, 1, 0]]

A strategy where I'd simply take the actual average of all features across observations would generate a synthetic datapoint such as follows, which I'd then append to the matrix before doing the similarity calculation.

[ 0.5 ,  0.25,  0.75,  0.5 ,  0.25,  0.75,  0.25,  0.75,  0.25]

While this might work well with certain similarity metrics (e.g. L1 distance) I'm sure there are much better ways for cosine similarity. Though, at the moment, I'm having trouble reasoning my way through angles between lines in high dimensional space.

Any ideas?

$\endgroup$
5
  • $\begingroup$ I didn't quite get your question. Do you intend to compute pairwise cosine similarities between every pair of row vectors (observations)? $\endgroup$
    – Debasis
    Commented Jul 1, 2014 at 18:37
  • $\begingroup$ Moreover, I didn't quite get why are you taking the average? $\endgroup$
    – Debasis
    Commented Jul 1, 2014 at 18:37
  • $\begingroup$ If your observations are just 0s and 1s, then I don't think cosine similarity will work. Perhaps you should consider using Tanimoto similarity, which considers similarity across bitmaps. $\endgroup$
    – buruzaemon
    Commented Jul 2, 2014 at 1:30
  • $\begingroup$ @Debasis yes, I do plan to compute similarities between each row. And I'm only taking the average as an example strategy to show what my computations might involve. $\endgroup$ Commented Jul 2, 2014 at 3:30
  • $\begingroup$ @buruzaemon my observations aren't actually 0s and 1s, though I do like the simplicity of those kind of similarities. I actually asked this question because I'm interested in what the right answer for cosine similarities is. But yeah, I do appreciate the advice. $\endgroup$ Commented Jul 2, 2014 at 3:35

3 Answers 3

13
$\begingroup$

You are doing the correct thing. Technically, this averaging leads to computing the centroid in the Euclidean space of a set of N points. The centroid works pretty well with cosine similarities (cosine of the angles between normalized vectors), e.g. the Rocchio algorithm.

$\endgroup$
1
  • 1
    $\begingroup$ Thanks! I would upvote this, but I don't have the reputation necessary. Maybe someone else can do that for me? $\endgroup$ Commented Jul 2, 2014 at 3:43
2
$\begingroup$

As @Debasis writes, what you are doing is correct. Do not worry about the relative values as the cosine similarity focusses on the angle, not the length of the vector.

Note that the averages that you compute actually are the proportion of observations that have that feature in your subset. If the subset is sufficiently large, you can interpret them as probabilities.

$\endgroup$
1
  • $\begingroup$ Thanks for the insight. $\endgroup$
    – K3---rnc
    Commented Mar 31, 2022 at 21:30
0
$\begingroup$

Depending on a task there could be a better strategy than simply averaging the vectors.

Imagine following scenario.

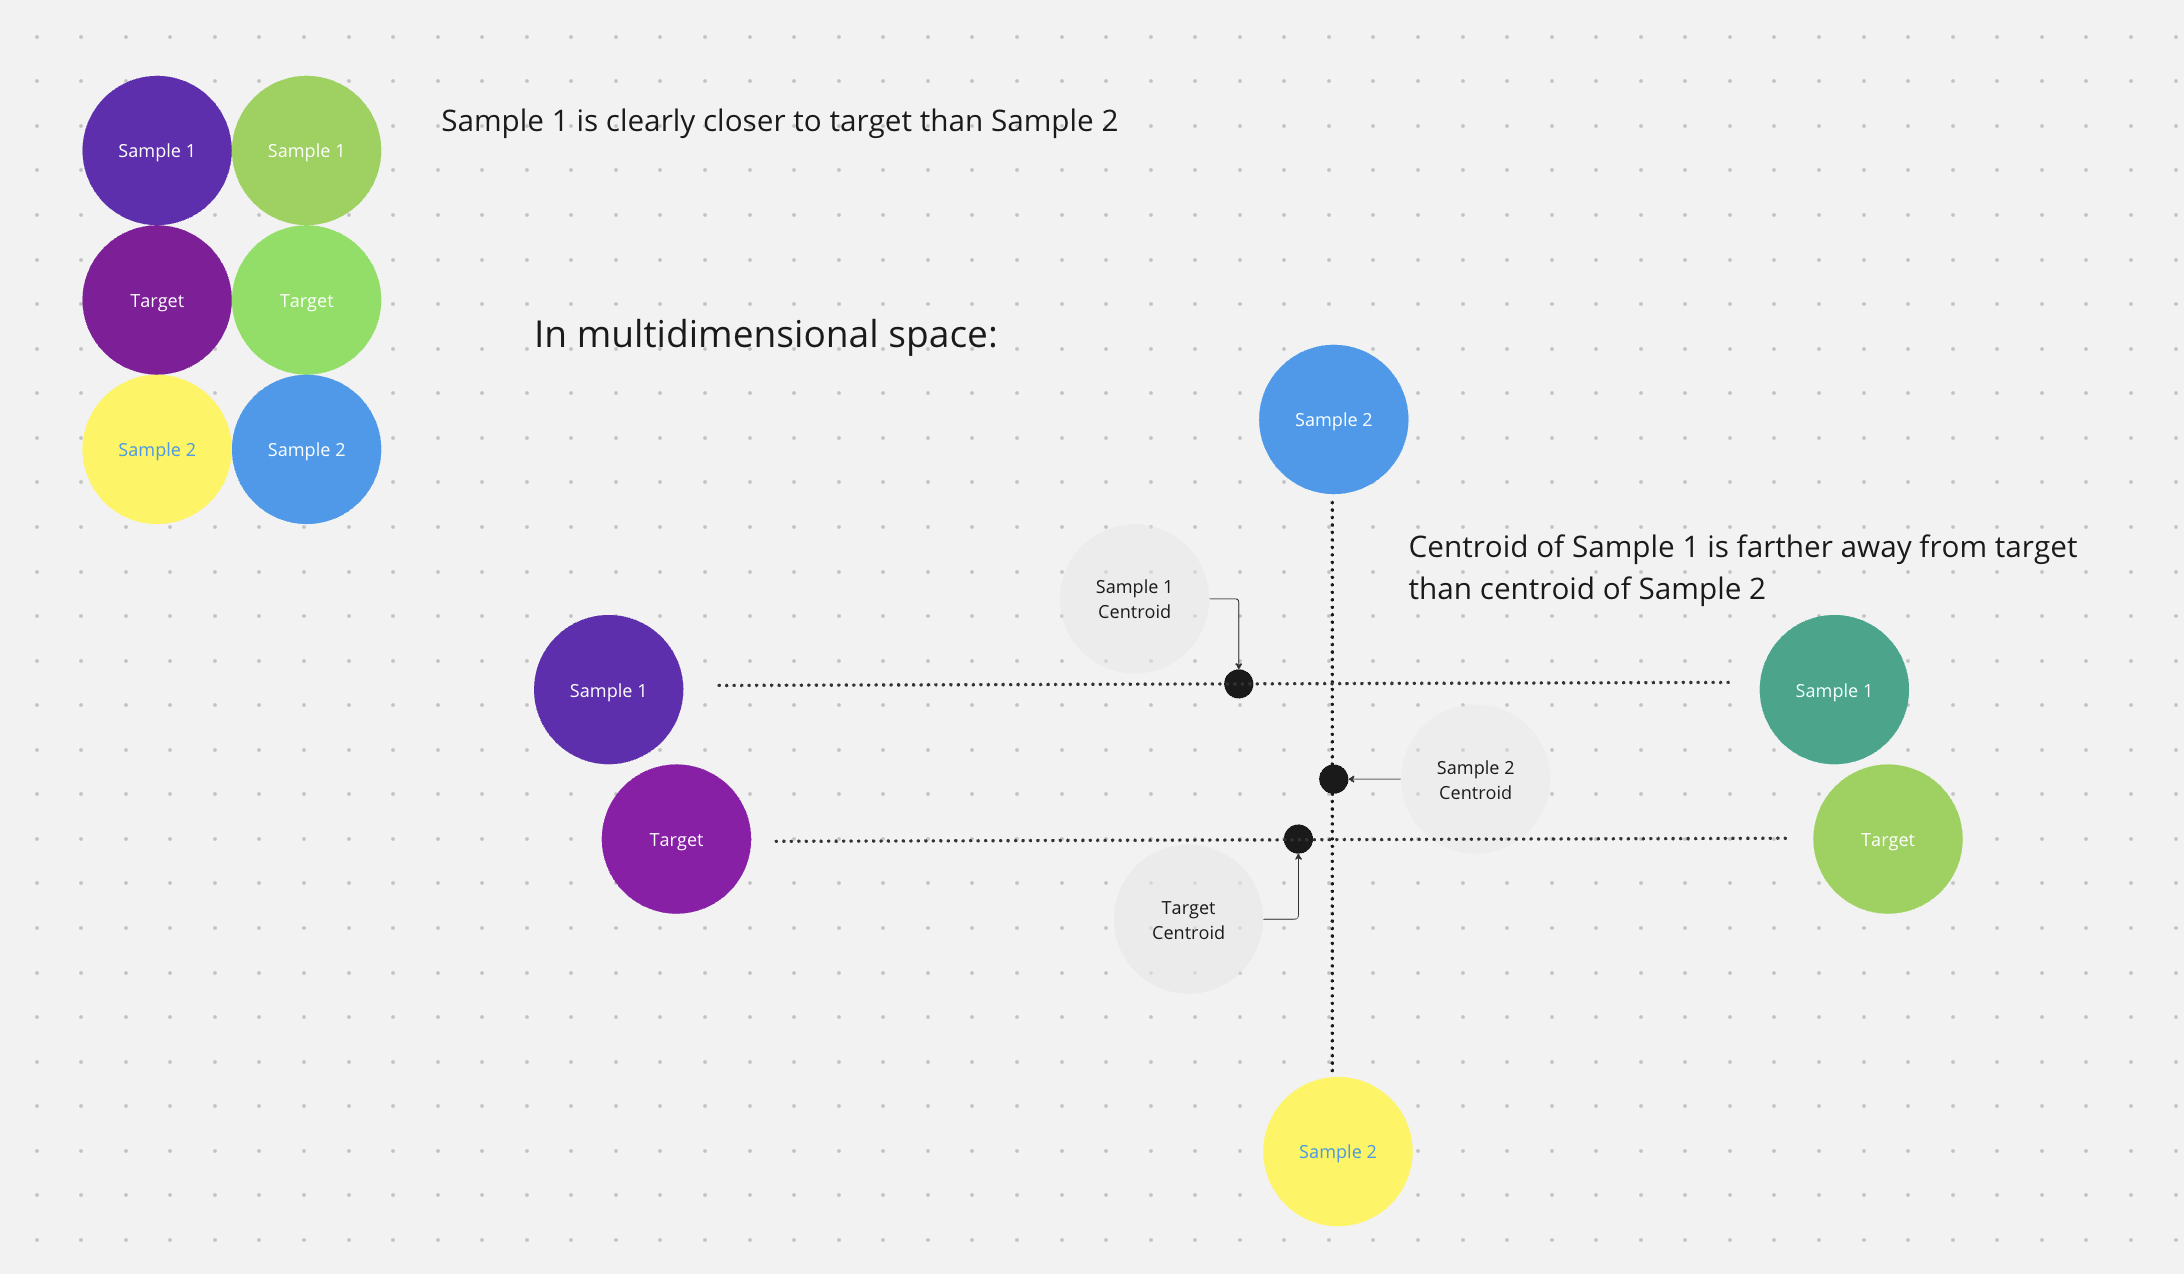
Say we have two point clouds of particular shape in multidimensional space, representing presence of particular orthogonal features.

It could be particular colours, sampled from the surface of a flower.

If you average complimentary colours, you get something grey in-between, but both samples initially had very vivid and saturated colours.

In the end the centroids of perceptibly similar objects would be more distant from the centroid of the search target than the centroid of a more distant object!

So if you find a maximum similarity for each point in target features among the sample's features, and then average those similarities, this problem is solved.

I found that this way I get a better result in similarity search. The formula is as follows:

average by i (maximum by j (cosine distance (a[i], b[j] ) ) )

There could be even better strategy. For example, you might want to apply some more sophisticated activation function to pairs of points instead of max and a better averaging function to too.

Samples of objects with multiple features

$\endgroup$

Your Answer

By clicking “Post Your Answer”, you agree to our terms of service and acknowledge you have read our privacy policy.

Not the answer you're looking for? Browse other questions tagged or ask your own question.