I am trying to classify stock images into 4 categories:
- Category 1: Image patterns which gives more than 10% profit next 3 day.
- Category 2: Image patterns which gives less than 10% profit but greater than 0% next 3 day.
- Category 3: Image patterns which gives more than -0.01% but greater than -10% loss next 3 day.
- Category 4: Image patterns which gives more than -10% loss next 3 day
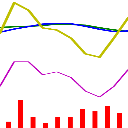
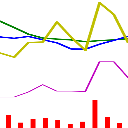
I have divided these Images in to 4 category, below are the Images from category 1 and category 2.
Image contains 10 day stock movement, and classification category are generate from next 3 day stock data.
Red Bar is volume Traded of that stock.
Pink line is RSI(14) (Relative strength Index)
Yellow line is stock price.
Blue and Green line are moving average 10, 20 respectively.
I know by seeing the image it is hard to differentiate between them but this is what I am trying to find out can I classify it using CNN.
My CNN:
  (layer1): Sequential(
    (0): Conv2d(3, 64, kernel_size=(5, 5), stride=(1, 1), padding=(2, 2))
    (1): ReLU()
    (2): MaxPool2d(kernel_size=2, stride=2, padding=0, dilation=1, ceil_mode=False)
  )
  (layer2): Sequential(
    (0): Conv2d(64, 128, kernel_size=(5, 5), stride=(1, 1), padding=(2, 2))
    (1): ReLU()
    (2): MaxPool2d(kernel_size=2, stride=2, padding=0, dilation=1, ceil_mode=False)
  )
  (layer3): Sequential(
    (0): Conv2d(128, 256, kernel_size=(5, 5), stride=(1, 1), padding=(2, 2))
    (1): ReLU()
    (2): MaxPool2d(kernel_size=2, stride=2, padding=0, dilation=1, ceil_mode=False)
  )
  (drop_out): Dropout(p=0.5, inplace=False)
  (fc1): Linear(in_features=65536, out_features=1024, bias=True)
  (fc2): Linear(in_features=1024, out_features=512, bias=True)
  (fc3): Linear(in_features=512, out_features=128, bias=True)
  (fc4): Linear(in_features=128, out_features=4, bias=True)
Optimizer: Adam, Loss: CrossEntropyLoss.
But the problem is CNN ends up classifying same class for each image to obtain 25% accuracy.
Am I working in wrong direction, should I work on imporving data or try other technique like LSTM?


