I'm working on a regression problem. My aim is to "learn" the distribution of a continuous target $y$ as good as possible to make predictions. My model looks like:
$$y_i=\beta X_i + u_i.$$
$y$ is right skewed (positive skewness) and consists of positive and negative integer values.
$X$ is a matrix containing columns with float and integer values. There also is a large(er) number of indicators (dummy variables)
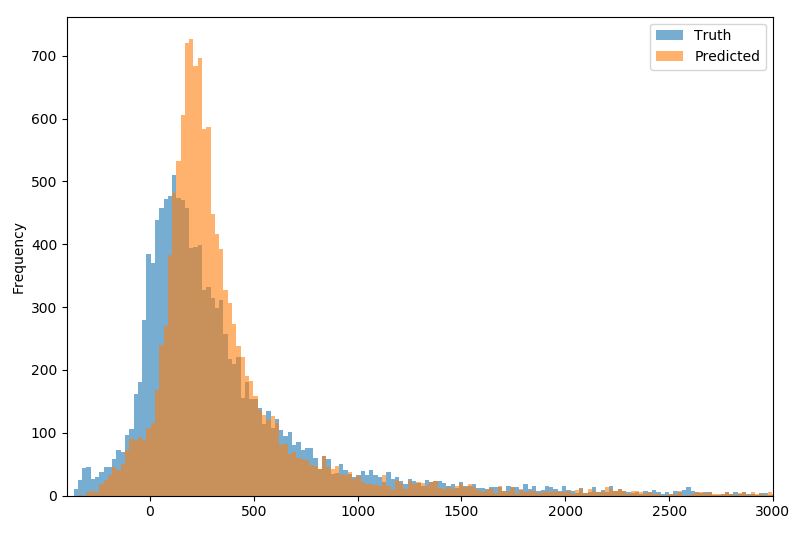
These are my results. Here I compare the distribution of the actual $y_i$ (truth, blue) and the predicted $\hat{y_i}$ (predicted, yellow):
As you can see from the figure, I tend to underestimate values in the lower range (around zero) and I overestimate values somewhere between 200 and 500.
I would like to improve my estimation especially in the range somewhere around zero and 600, where most observations are found. I wonder what my options are?
Please note that the whole range of data is relevant to me, so that I cannot simply prune the data/distribution.
So far I did no feature engineering, scaling etc. What I tried was a number of different estimation methods, such as linear regression (OLS), generalised models (GAM) with local regression and regression splines, lasso/ridge, Keras neural net, boosting with LightGBM and Catboost. All of them produced very similar results (as shown in the figure above).
Edit [2019-12-28]:
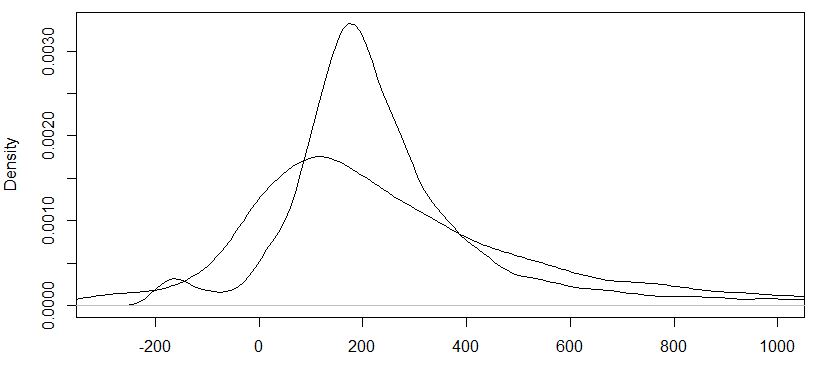
A brief follow-up to my original question: I have applied a logistic transformation to my $y$ and estimated a GAM model. Unfortunately the results are not much better than with non-transformaed data. MAE decreases slightly, but the general fit is still not too good (see figure below, the "flat" curve are actual values and the pointed curve are predicted values after re-transformation).
I prefer to stick to linear models (OLS, GAM, Lasso) since boosting or neural nets did not deliver much better results than linear models.


