I have downloaded a satellite image from Google Earth Pro software corresponding to a particular date for a selected area around a place. I want to specifically segment the road lanes from the image using Kmeans algorithm. How can this be achieved?
$\begingroup$
$\endgroup$
1
-
2$\begingroup$ Good quality results cannot be achieved with the data you have and methods you mention. You probably need to look for map datasets or software devoted for this purpose. $\endgroup$– ValentasCommented Jan 1, 2020 at 13:15
Add a comment
|
1 Answer
$\begingroup$
$\endgroup$
Whoa, are you trying to do clustering based on satellite images?! Just use the underlying long & lat coordinates to do this. It will be infinitely easier and so much more accurate too. Look at the example code below and try to adapt that to your specific case.
import pandas as pd
import numpy as np
import matplotlib.pyplot as plt
from sklearn.cluster import KMeans
import seaborn as sns; sns.set()
import csv

df = pd.read_csv('C:\\your_path\\properties_2017.csv')
df.head(10)

df.dropna(axis=0,how='any',subset=['latitude','longitude'],inplace=True)

# Variable with the Longitude and Latitude
X=df.loc[:,['parcelid','latitude','longitude']]
X.head(10)

K_clusters = range(1,10)
kmeans = [KMeans(n_clusters=i)

for i in K_clusters]
Y_axis = df[['latitude']]
X_axis = df[['longitude']]
score = [kmeans[i].fit(Y_axis).score(Y_axis)

for i in range(len(kmeans))] # Visualize
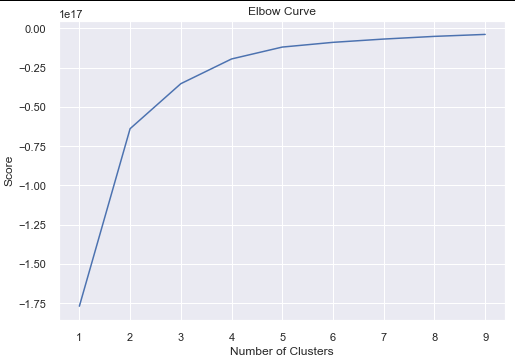
plt.plot(K_clusters, score)
plt.xlabel('Number of Clusters')
plt.ylabel('Score')
plt.title('Elbow Curve')
plt.show()
kmeans = KMeans(n_clusters = 3, init ='k-means++')
kmeans.fit(X[X.columns[1:3]]) # Compute k-means clustering.X['cluster_label'] = kmeans.fit_predict(X[X.columns[1:3]])centers = kmeans.cluster_centers_ # Coordinates of cluster centers.labels = kmeans.predict(X[X.columns[1:3]]) # Labels of each pointX.head(10)


X['cluster_label'] = kmeans.fit_predict(X[X.columns[1:3]])
centers = kmeans.cluster_centers_ # Coordinates of cluster centers.
labels = kmeans.predict(X[X.columns[1:3]]) # Labels of each pointX.head(10)


X.head(5)


X = X[['parcelid','cluster_label']]
X.head(5)


clustered_data = df.merge(X, left_on='parcelid', right_on='parcelid')
clustered_data.head(5)

centers = kmeans.cluster_centers_
print(centers)

# Final Result:
   parcelid  cluster_label
0  10754147              0
1  10759547              0
2  10843547              2
3  10859147              2
4  10879947              2
The data source is here:

