0
$\begingroup$

I am working on a project where I need to figure out the point of interest in time series data.

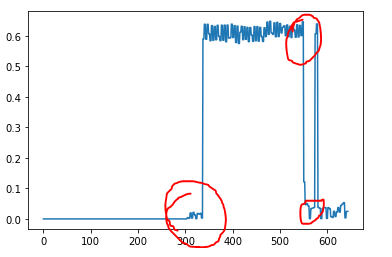
enter image description here

From the picture you can probably understand a bit more what I mean. Basically, imagine this is the electricity consumption of a washing machine. From this, I want to identify these points where the consumption changes drastically. In this way I will be able to identify more or less what the machine is doing.

I only have raw data so I can't use any supervised learning algorithm, I was wondering if there are ways to do it mathematically without spending too much computation time.

Regards and thanks in advance.

$\endgroup$
2
  • $\begingroup$ Can't we just extract data from its x-value? $\endgroup$
    – Idonknow
    Commented May 27, 2020 at 11:53
  • $\begingroup$ What do you mean? This is just an example, curves can be different of course. $\endgroup$
    – GhzNcl
    Commented May 27, 2020 at 13:20

2 Answers 2

1
$\begingroup$

Try derivative after either a low-pass filter or smoothing (probably exponential smoothing) to cut down on the noise. Big changes result in a big derivative (up or down).

$\endgroup$
4
  • $\begingroup$ Sounds good. I understand the low-pass filter and smoothing part but how would I tackle the derivative part? Because I do not have a function representing the curve but just raw data: time, value. Thanks a lot. $\endgroup$
    – GhzNcl
    Commented May 28, 2020 at 9:03
  • $\begingroup$ What software is being used to plot the data? Most languages will have one or more ways built-in. $\endgroup$
    – C8H10N4O2
    Commented May 28, 2020 at 15:16
  • $\begingroup$ I am doing everything in Python. I am plotting using Matplotlib. $\endgroup$
    – GhzNcl
    Commented May 28, 2020 at 22:51
  • $\begingroup$ Maybe start with gradient from numpy if already in Python. $\endgroup$
    – C8H10N4O2
    Commented May 30, 2020 at 1:55
0
$\begingroup$

According to your examples, a bunch of ifs should do. A rough version of the logic, in python code, could be this:

  last_seen_point_of_interest_time = float('-inf')
  last_value = 0
  last_time = None
  for value, time in curve_points:
    level_change = math.abs(value - last_value) > 0.4
    last_point_was_a_while_ago = time - last_seen_point_of_interest_time > threshold
    if level_change and last_point_was_a_while_ago:
       mark_point_of_interest(last_value, last_time)
       last_seen_point_of_interest_time = time
    last_value = value
    last_time = time
$\endgroup$

Your Answer

By clicking “Post Your Answer”, you agree to our terms of service and acknowledge you have read our privacy policy.

Not the answer you're looking for? Browse other questions tagged or ask your own question.