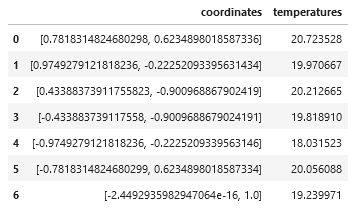
Context: Trying to forecast some sort of consumption value (e.g. water) using datetime features and exogenous variables (like temperature).
Take some datetime features like week days (mon=1, tue=2, ..., sun=7) and months (jan=1, ..., dec=12).
A naive KNN regressor will judge that the distance between Sunday and Monday is 6, between December and January is 11, though it is in fact 1 in both cases.
Domains
hours = np.arange(1, 25)
days = np.arange(1, 8)
months = np.arange(1, 13)

days
>>> array([1, 2, 3, 4, 5, 6, 7])
type(days)
>>> numpy.ndarray
Function
A custom distance function is possible:
def distance(x, y, domain):
   direct = abs(x - y)
   round_trip = domain - direct
   return min(direct, round_trip)
Resulting in:
# weeks
distance(x=1, y=7, domain=7)
>>> 1
distance(x=4, y=2, domain=7)
>>> 2

# months
distance(x=1, y=11, domain=12)
>>> 2
distance(x=1, y=3, domain=12)
>>> 2
However, custom distance functions with Sci-Kit's KNeighborsRegressor make it slow, and I don't want to use it on other features, per se.
Coordinates
An alternative I was thinking of is using a tuple to represent coordinates in vector space, much like we represent the hours of the day on a round clock.
def to_coordinates(domain):
    """ Projects a linear range on the unit circle,
        by dividing the circumference (c) by the domain size,
        thus giving every point equal spacing.
    """
    # circumference
    c = np.pi * 2

    # equal spacing
    a = c / max(domain)

    # array of x and y
    return np.sin(a*domain), np.cos(a*domain)
Resulting in:
x, y = to_coordinates(days)

# figure
plt.figure(figsize=(8, 8), dpi=80)

# draw unit circle
t = np.linspace(0, np.pi*2, 100)
plt.plot(np.cos(t), np.sin(t), linewidth=1)

# add coordinates
plt.scatter(x, y);
Clearly, this gets me the symmetry I am looking for when computing the distance.
Question
Now what I cannot figure out is: What data type can I use to represent these vectors best, so that the knn regressor automatically calculates the distance? Perhaps an array of tuples; a 2d numpy array?
Attempt
It becomes problematic as soon as I try to mix coordinates with other variables. Currently, the most intuitive attempt raises an exception:
data = df.values
The target variable, for simple demonstration purposes, is the categorical domain variable days.
TypeError                                 Traceback (most recent call last)
TypeError: only size-1 arrays can be converted to Python scalars

The above exception was the direct cause of the following exception:

ValueError                                Traceback (most recent call last)
<ipython-input-112-a34d184ab644> in <module>
      1 neigh = KNeighborsClassifier(n_neighbors=3)
----> 2 neigh.fit(data, days)

ValueError: setting an array element with a sequence.
I just want the algorithm to be able to process a new observation (a coordinate representing the day of the week and temperature) and find the closest matches. I am aware the coordinate is, of course, a direct representation of the target variable, and thus leaks the answer, but it's about enabling the math of the algorithm.
Thank you in advance.


neigh.fit(data, days)what are the shapes ofdataanddays? Am I understanding that you're predicting temperature from datetime? $\endgroup$.fit():day of week (int)andtemperature (float). However, this gets me in trouble due to the mentioned lack of symmetry (it will compute Monday-Sunday=6). Instead, I try using coordinates. This gets me the desired symmetry but results in columns with nested arrays:coordinates (list of tuples/numpy array of numpy arrays)andtemperature (float). The last part is my hurdle. $\endgroup$days_coordinates (x, y)into separate columnsdays_xanddays_y? Thereafter, If I want one feature to be more important than the other I can standardize all features first, and then multiply them by custom weights? $\endgroup$days_xanddays_y`into separate columns is the way to go if you take the unit circle approach. On feature importance - my intuition is that re-weighting features as you said will do what you want if by "feature importance", you mean "how much each feature matters for determining distance". $\endgroup$