4
$\begingroup$

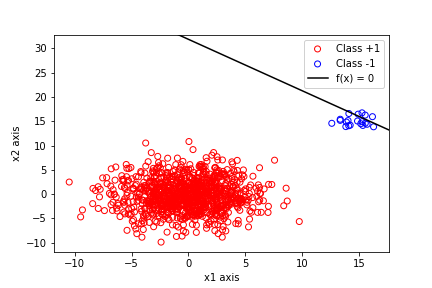
I have 1000 data points from the bivariate normal distribution $\mathcal{N}$ with mean $(0,0)$ and variance $\sigma_1^2=\sigma_2^2=10$ with the covariances being $0$. Also there are 20 more points from another bivariate normal distibution with mean $(15,15)$ with variance $\sigma_1^2=\sigma_2^2=1$ and with the covariances being $0$ again. I used the least squares method to calculate the parameters of the decision bounday $\theta_0 + \theta_1 x_1 + \theta_2 x_2=0$, that is $$\theta = (X^T X)^{-1}(X^Ty)$$ where $y$ is a column matrix with labels $+1$ for points from the first class and $-1$ for points from the second. The resuliting plot is as follows:

enter image description here

It is obvious that the decision boundary failed to be correct, as it passes right through class $-1$ and therefore it won't classify correctly future points that might stem from the same distribution. Now, there is the issue of why this is happenning. I understand that the main problem here is the imbalance of the data set, as there are $1000$ points from one class but only $20$ from the other. This, intuitively, makes sense.

What I want someone to help me with, if possible, is to understand how this imbalance problem is incorporated into the process of minimizing the least squares cost function $$J(\theta)=\sum_{n=1}^{200}(y_n-\theta^T x_n)^2$$

How does the fact that there are only $20$ points from the second class causes the minimzation task $\frac{\partial J(\theta)}{\partial \theta}=0$ to "fail"? How do the insufficient amount of these points causes this line to pass right through them? If there is some mathematical way to show me this, it would be nice, as I already got the intuition.

$\endgroup$

4 Answers 4

0
$\begingroup$

For those data points, a threshold just on x1 axis would perfectly separate the two distributions. You could fit a decision stump to calculate the single parameter of the decision boundary.

$\endgroup$
1
  • 2
    $\begingroup$ Thank you for the reply. However I am not asking for alternatives. Im asking how, in this particular example, the imbalance in the data set is causing the decision boundary to appear where it appears. And Im looking for a $\textit{mathematical}$ way to show this. Thank you $\endgroup$
    – thenac
    Commented Oct 21, 2020 at 22:12
0
$\begingroup$

I contend that this is a feature, not a bug.

Going into the classification, not knowing the values of $x_1$ or $x_2$, it is much more likely that your point belongs to $+1$ than $-1$. Consequently, you shouldn’t just need decent evidence that a point is $-1$. You should need overwhelming evidence.

The red $+1$ group, loosely speaking, exists in the square $[-10,10]\times[-10,10]$. The closest blue $-1$ point is at about $(12,15)$, which is not all that far from the $+1$ zone. The decision boundary is telling you that $(12,15)$ is not sufficiently far from the $+1$ zone to overcome the high “prior” probability of being $+1$. To get sufficiently far from the $+1$ zone not to be classified as $+1$, you need to be above about $(15,17)$.

If you simulate $100$ and then $200$ and then $500$ and then $1000$ blue $-1$ points to go along with that same $1000$ red $+1$ points, you will see the decision boundary drift towards where you would expect it to be in between the two groups.

You can do more with this idea of “prior” (and “posterior”) probability if you use a logistic regression to predict class membership probabilities. While this might warrant a new question, it might be more in line with the “mathematical” explanation that you want.

$\endgroup$
0
$\begingroup$

First, your linear probability model is quite different from a logistic regression. The latter would have no problem separating these classes; the coefficients would blow up to infinity trying to push the predicted log-odds out to $\pm\infty$, but wherever you stop the process you will have perfect separation.

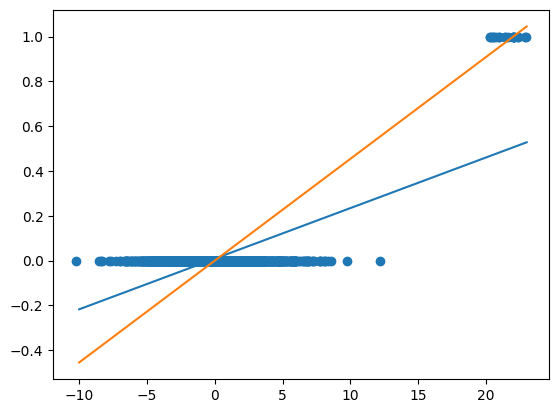
So this is really more of a regression problem than a classification one. And the two dimensions are really just distracting from the point, so here's a version with just one dimension: dense scatter plot at y=0 with x from -10 to 10ish, at y=1 with x around 20; two lines, one blue with shallow slope through the y=0 blob but well below the y=1 blob, the other orange passing through the middle of both blobs

The blue line is the fitted linear regression, the orange what I imagine you think looks more natural. The problem is in the rather large number of dots near $x=\pm5$ (e.g., but of course taking all the points into consideration): under the orange model, the squared error there is significantly larger, and since there are so many more of them than the ones with $y=1$, the total loss $J$ is better off with the blue line.

$\endgroup$
0
$\begingroup$

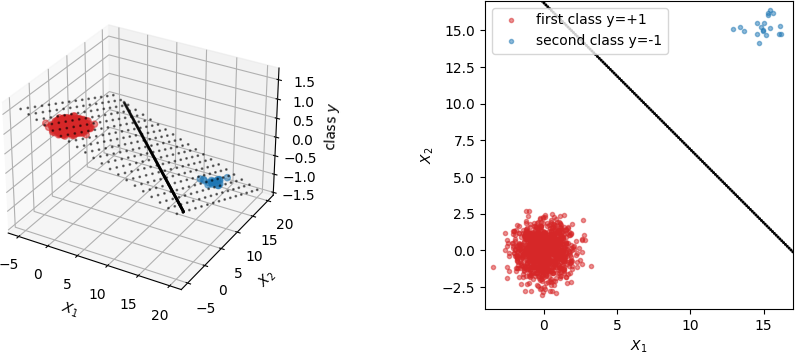
First of all, the plot in the question does not look correct to me. This is what I would get when I perform the same calculation: enter image description here

There, on the left the small markers show the plane in "3D" that results from the closed form solution given by @thenac (which in fact is the solution of a regression problem). The line shown in both plots is the decision boundary, i.e., where the plane has "class y=0". The fewer data for the second class, the more horizontal the decision plane gets (because the red marker have more weight as compared to the blue ones) and the further the decision boundary is moved away from the majority class. This is also the link to the least squares minimization with the given cost function.

Using least squares for classification is definitely not a good choice as it is not robust concerning adding new data, but this was not the question.

(finally, one could also mathematically write down how $J$ and $\partial J/\partial \theta$ looks for the simplified situation that all data points are exactly located in either one or the other point. Then, it is really just a weighting of the two terms showing up in $J(\theta)$.)

$\endgroup$

Your Answer

By clicking “Post Your Answer”, you agree to our terms of service and acknowledge you have read our privacy policy.

Not the answer you're looking for? Browse other questions tagged or ask your own question.