2
$\begingroup$

Imagine we have some lists of features that are changing in time. Each row of the list corresponds to a sample (Change in space). I would like to know whether machine learning is able to determine the effect of each sample on another sample. For instance, the target value for the sample "S" is dependent on features of samples "S-4","S-3","S-2","S-1","S+1","S+2","S+3". I have seen something like Active learning and Causal Inference but still not sure each of which would be useful for my aim. To elaborate more, imagine we have the picture below: enter image description here
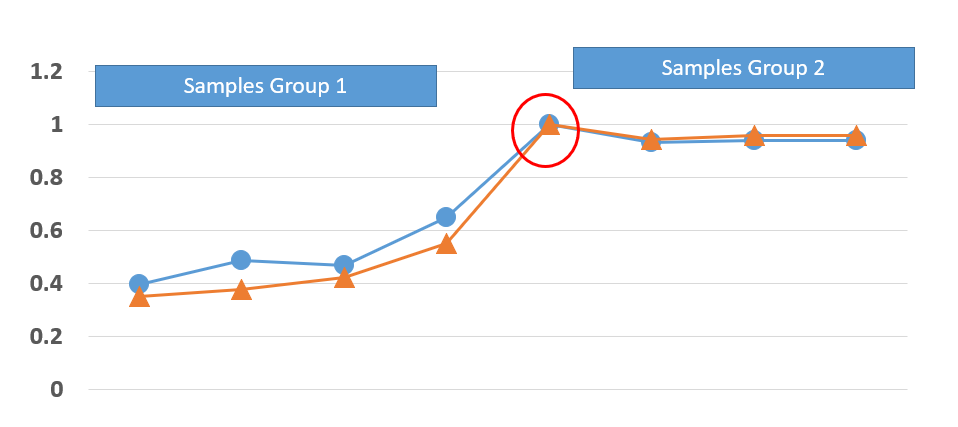
the red line is a result for one year and the blue one is next year. we have these results in an appropriate amount so in this manner we do not have problem. for the target that has been shown by the red circle and other samples, we have different features. But I am looking for an algorithm to tell me whether group 1 is affecting my target in the red circle point or group 2. To this aim, it is good to use Causal inference or Active Learning?

$\endgroup$
3
  • $\begingroup$ Could do you explain with you mean with effect? Based on your current description, it looks more that you are trying to understand the feature weight instead.Shaply Values are better at this (see github.com/slundberg/shap) $\endgroup$ Commented Dec 1, 2020 at 14:17
  • $\begingroup$ @BenoitDescamps Thanks for the response. I meant I'm not looking for the correlation of features. I want to see the effect of features sample "S-2" on the target value of "S" and so on. On the target values, features are affecting but no one has done the effect of sample features on points target. $\endgroup$
    – john22
    Commented Dec 1, 2020 at 15:35
  • $\begingroup$ then causal inference is what you need. I will write an answer below, we can continue there $\endgroup$ Commented Dec 1, 2020 at 16:07

1 Answer 1

1
$\begingroup$

This is how the problem is formulated as a Causal Inference problem:

Take group 1 as the Control Group and group 2 the Treatment Group. Based on the observations ( "S-4","S-3","S-2","S-1","S+1","S+2","S+3"), a model is fit on the observations. How many models depend on the type of learning, S,T or X-learner.

Basically, what these learners do, is separately fit the features to the target (S), conditionally on the features originating from control or treatment.

Once you have fit the learners, a treatment effect is estimated. You can see the treatment effect as the difference between the predictions on either group, given the knowledge restricted to the opposite group.

Here is a sample code from Uber's causalML

from causalml.inference.meta import XGBTRegressor

y, X, treatment = load_data()


xg = XGBTRegressor(random_state=42)
te, lb, ub = xg.estimate_ate(X, treatment, y)
print('Average Treatment Effect (XGBoost): {:.2f} ({:.2f}, {:.2f})'.format(te[0], lb[0], ub[0]))
$\endgroup$
1
  • $\begingroup$ Sorry for disturbing you, just one more question, how much data does it required? I mean, if I have had 100 lists of 1000 points, to understand the intervention of the 500th point, I need for instance 100 points before and after the 500th point. So my data frame becomes 100segment of 201 points? Am I right? $\endgroup$
    – john22
    Commented Dec 2, 2020 at 23:06

Your Answer

By clicking “Post Your Answer”, you agree to our terms of service and acknowledge you have read our privacy policy.

Not the answer you're looking for? Browse other questions tagged or ask your own question.