About your experiment:
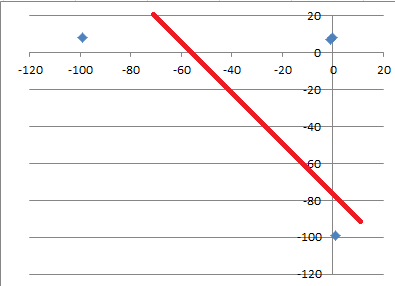
Adding -99... is creating outliers and that bit of information is heavy (numerically speaking, it is huge) and will affect parameter tuning. For example, suppose you have this data:
| Feature1 | Feature2 |
|----------|----------|
| 0        | 8        |
| -1       | 7        |
| 1        | -        |
| -        | 8        |
And you try filling the missing values with -99, now try to fit a linear regression trough the data. Can you see that you don't be able to fit it properly?
The line won't fit, and this will yield bad performance.
Adding 0 values on the other hand will give a slightly better line:
It is still not good, but slightly better since the scale of the parameters will be more realistic.
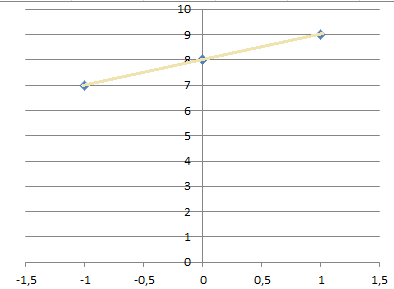
Now, using average, is this case will give you even better curve, but using regression will give you a perfect fitting line:
Note: I need to remake those images, but these should do until I have the time for it.


