I have applied the kMeans Clustering algorithm to a dataframe and have gained cluster labels for each row. I had selected only two features.

There
There are 4 clusters.

I
I want to visualize the datapoints in 2D plane with color-coded clusters which I want to look like this-

image.png1

Ignore the labels. I would like to plot cluster centers instead.

I
I have looked in many blog posts, articles etc. None was helpful.

What
What is the most straightforward to achieve this?

I have applied the kMeans Clustering algorithm to a dataframe and have gained cluster labels for each row. I had selected only two features.

There are 4 clusters.

I want to visualize the datapoints in 2D plane with color-coded clusters which I want to look like this-

image.png

Ignore the labels. I would like to plot cluster centers instead.

I have looked in many blog posts, articles etc. None was helpful.

What is the most straightforward to achieve this?

I have applied the kMeans Clustering algorithm to a dataframe and have gained cluster labels for each row. I had selected only two features.
There are 4 clusters.
I want to visualize the datapoints in 2D plane with color-coded clusters which I want to look like this-

1

Ignore the labels. I would like to plot cluster centers instead.
I have looked in many blog posts, articles etc. None was helpful.
What is the most straightforward to achieve this?
Source Link
truth
  • 280
  • 1
  • 9

What is the most straightforward way to visualize color-coded clusters along with the cluster centers?

I have applied the kMeans Clustering algorithm to a dataframe and have gained cluster labels for each row. I had selected only two features.

There are 4 clusters.

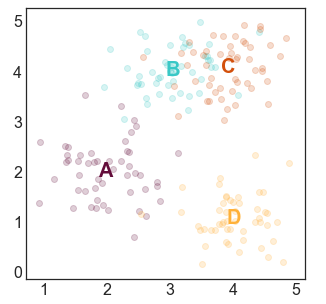
I want to visualize the datapoints in 2D plane with color-coded clusters which I want to look like this-

image.png

Ignore the labels. I would like to plot cluster centers instead.

I have looked in many blog posts, articles etc. None was helpful.

What is the most straightforward to achieve this?