2
$\begingroup$

I have done and read a csv file and then plotted the values of a single column using K-means

import pandas as pd
import numpy as np
import matplotlib.pyplot as plt
from matplotlib import style
style.use("ggplot")
from sklearn.cluster import KMeans

data=pd.read_csv(r'Plot_file.csv', encoding='unicode_escape', sep=';')
data.head()

feature_names = ['Plot_Column]
X = np.asarray(data[feature_names])

from sklearn.cluster import KMeans

labels = KMeans(5, random_state=10).fit_predict(X)
plt.scatter(X[:, 0], X[:, 0], c=labels,
    s=50, cmap='rainbow');


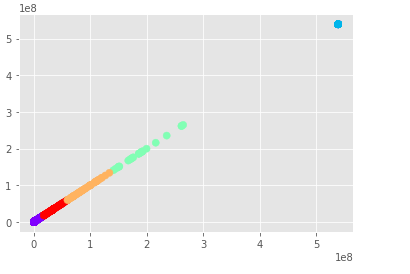
The output looks like this, it is linear because when clustering one column it can only look at the relative distance between the values in that column and will always be linear on any chart as it is only clustering one dimension

enter image description here

How would I go with detecting anomalies in this case?

The column that I am clustering the values from has around 12 thousand rows and varying numbers.

$\endgroup$

1 Answer 1

1
$\begingroup$

If you have a one dim data, why do you need to use K-means?

In such a case, to detect the outlier I would recommend creating a simple histogram and then based on its shape you can visually find the outliers. To get a proper outlier threshold you can use np.quantile() function.

$\endgroup$
3
  • $\begingroup$ the dataframe has a ot of columns but I just want to focus on one. I use K-means because it is part of a research where I just have to check how it performs in one column and if I can detect outliers. $\endgroup$
    – E199504
    Commented Feb 15, 2020 at 15:28
  • $\begingroup$ What is the difference between the data that has multiple columns and you want to use only one of them, and the data that has only one column? In both of the cases, I don't see any particular reason to use K means instead of just a simple histogram. $\endgroup$ Commented Feb 15, 2020 at 17:44
  • $\begingroup$ There is nothing different with the other columns. I goal is just to find anomalies within one column. The reason why use k-means and not histogram is because it has to be part of machine learning. I histogram I can even plot it usin excel and not use matplotlib $\endgroup$
    – E199504
    Commented Feb 16, 2020 at 11:10

Your Answer

By clicking “Post Your Answer”, you agree to our terms of service and acknowledge you have read our privacy policy.

Not the answer you're looking for? Browse other questions tagged or ask your own question.