0
$\begingroup$

I would like to draw a histogram for each of the columns in my data.frame without having to write the the names of all of them, similar to what I did for inspect their unique values with:

sapply(data, unique)

So I tried

sapply(data, hist)

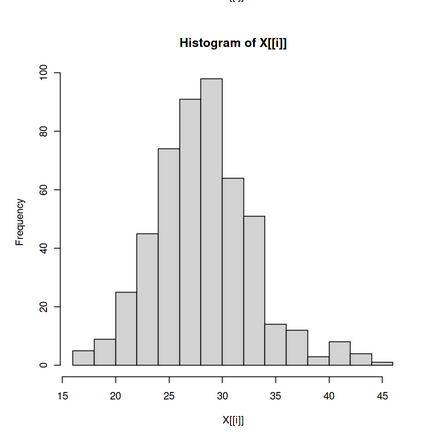
This command draws the histogram correctly, but the title for each of them is "Histogram of X[[i]]":

enter image description here

How can I draw the histograms but with the correct title?

$\endgroup$
1
  • $\begingroup$ Can you share a sample of your data with dput()? It will be easier for everyone to help! $\endgroup$ Commented Dec 24, 2021 at 4:34

1 Answer 1

0
$\begingroup$

I finally got it with the following code:

for (col in 2:ncol(data)) {
    hist(data[,col], main=colnames(data)[col],  xlab=colnames(data)[col])
}
$\endgroup$

Your Answer

By clicking “Post Your Answer”, you agree to our terms of service and acknowledge you have read our privacy policy.

Not the answer you're looking for? Browse other questions tagged or ask your own question.