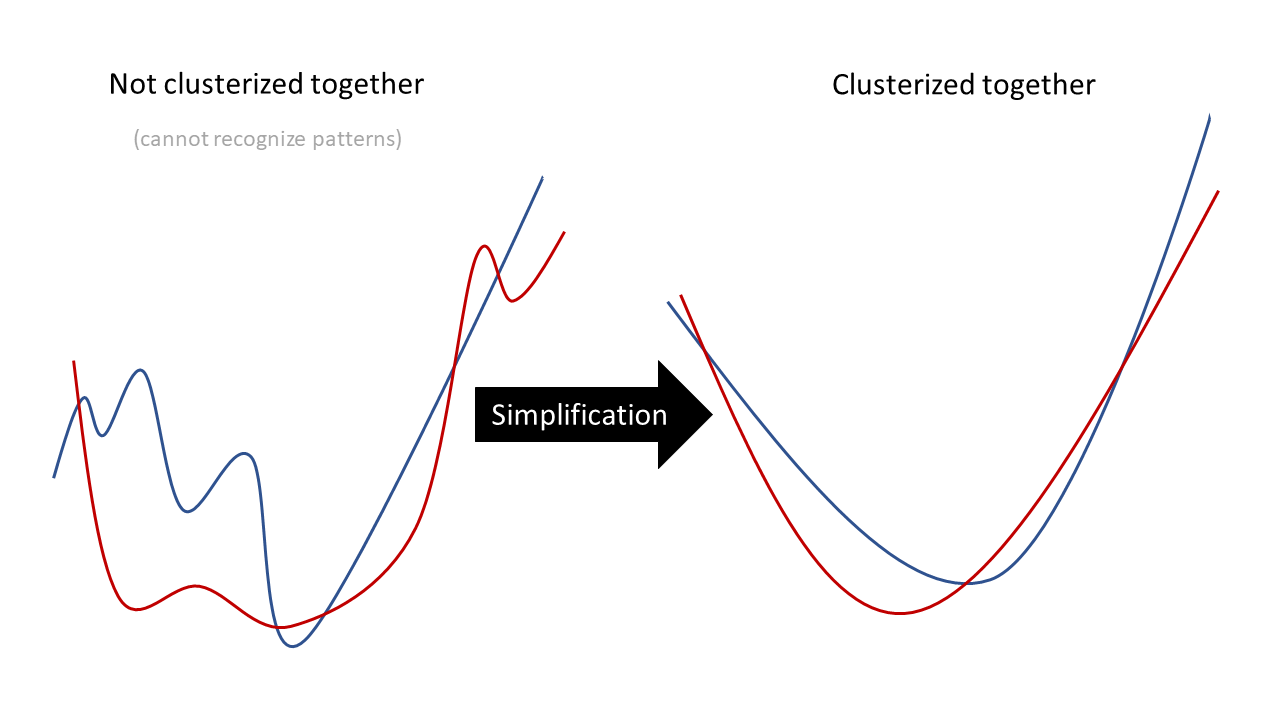
In other words, you are trying to differentiate each product by extracting their sales dynamics in order to group which ones are similar and help taking strategic decisions?
First, you would need to define a good solution to recognize sales dynamics, or to dissociate them automatically.
There are many potential solutions to that, but you have to keep in mind that if you are too precise in your data, sales fluctuations would not differentiate easily and the result would be no clusters at all.
That's why, you should remain realistic enough by simplifying your data to recognize patterns. Therefore you can use smoothing techniques like Pearson for instance.

Be careful because over simplification might not be useful: you have to find a good balance in order to have several clear and distinct clusters. It all depends on your business needs: Are you trying to find correlated sales at the same period, or do you want to find correlations with delayed patterns? Do you want to see clusters related to daily fluctuations, or weekly ones?
In all the cases, you will want to create several clustering views using different ranges of times and different degrees of simplifications.
Here are some tips to clusterize data using dimensional reduction algorithms:
Can t-SNE be applied to visualize time series datasets

