2
$\begingroup$

I have a problem. I am currently looking at a classifier and I would like to examine this using an ROC curve as a metric. However, questions have arisen to which I can not find an answer.

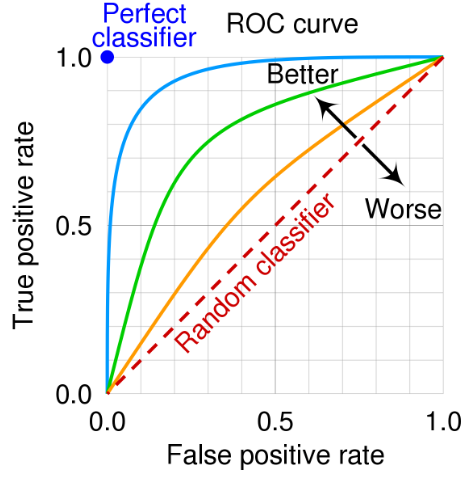
A ROC curve describes the following

ROC curves are frequently used to show in a graphical way the connection/trade-off between clinical sensitivity and specificity for every possible cut-off for a test or a combination of tests. In addition the area under the ROC curve gives an idea about the benefit of using the test(s) in question.

  • Why does an ROC curve become a curve in the first place?
  • Why does TP (True Positive) and FP (False Positive) rate change?
  • And why does the ratio vary?

enter image description here

$\endgroup$
1
  • 1
    $\begingroup$ You might be interested in this related question with an (hopefully clear) explanation of ROC curve. $\endgroup$
    – Erwan
    Commented Oct 20, 2022 at 14:34

1 Answer 1

2
$\begingroup$

ROC curve is a parametric one. Each point has a respective third coordinate (classification threshold).

The .predict_proba() method of sklearn models returns the class scores (the measure of a model's certainty of the prediction, or probability for well-calibrated models). By default, sklearn .predict() method predicts the class by comparing this score to 0.5 threshold. Neural network classifiers often similarly decide on the class by applying argmax to the scores.

If we operate on scores directly however, we can try as much possible thresholds as there are unique score values (plus a zero one, which would classify everything as 1).

Each possible threshold would yield a different confusion matrix. We start drawing the curve from the upper right (zero threshold), where most observations are classified as positive: that means perfect recall but also a high false positive rate. Towards the bottom left, more obervations are classified as negative: recall decreases, but so do false positives.

A decent classifier with respect to this metric, obviously, should yield high recall and low FPR at at least some threshold.

$\endgroup$

Your Answer

By clicking “Post Your Answer”, you agree to our terms of service and acknowledge you have read our privacy policy.

Not the answer you're looking for? Browse other questions tagged or ask your own question.