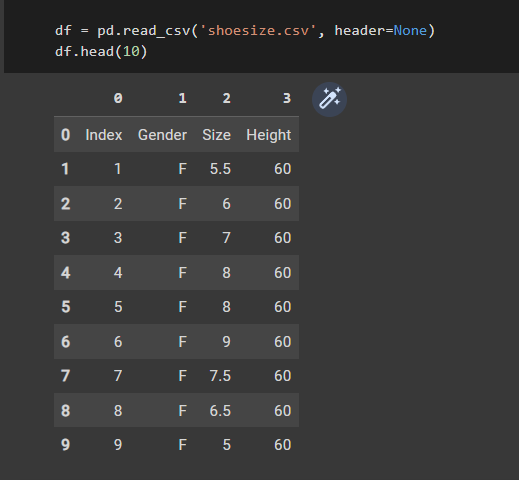
I have a big dataframe that consists of male and female shoe sizes. I am currently trying to plot size versus height for male and female separately. I have tried to slice the data and stored it in different variables, however I get an error when I try to plot it.
Here I tried to obrain rows that are only female height and shoe size
female_height = df.loc[(df[1] == 'F'), 3]
female_size = df.loc[(df[1] == 'F'), 2]
Here I tried to obrain rows that are only female height and shoe size
male_height = df.loc[(df[1] == 'M'), 3]
male_size = df.loc[(df[1] == 'M'), 2]
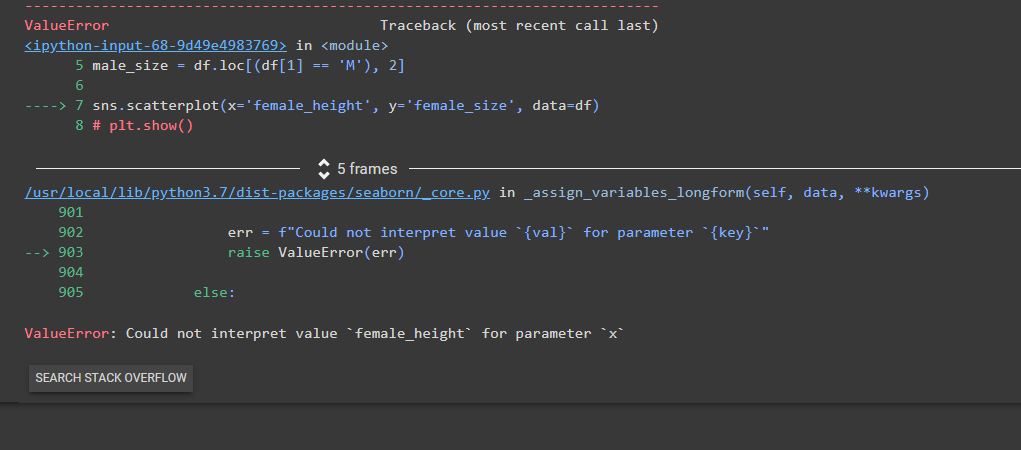
when I try to do the first plot only for female size and height I get this error:
sns.scatterplot(x='female_height', y='female_size', data=df)
plt.show()
I tested the columns and it displays exactly what I need, so what is causing this error?


