As a part of an exercise, I have the following dataset. Note that I have no idea where the values come from (are they based on something real or are they random numbers? Don't know...)
    a1     a2      s3 a4 a5  a6  a7    a8 a9 a10  a11 a12 a13    a14  a15 a16
0    b  30.83   0.000  u  g   w   v  1.25  t   t    1   f   g  202.0    0   +
1    a  58.67   4.460  u  g   q   h  3.04  t   t    6   f   g   43.0  560   +
2    a  24.50   0.500  u  g   q   h  1.50  t   f    0   f   g  280.0  824   +
3    b  27.83   1.540  u  g   w   v  3.75  t   t    5   t   g  100.0    3   +
4    b  20.17   5.625  u  g   w   v  1.71  t   f    0   f   s  120.0    0   +
..  ..    ...     ... .. ..  ..  ..   ... ..  ..  ...  ..  ..    ...  ...  ..
685  b  21.08  10.085  y  p   e   h  1.25  f   f    0   f   g  260.0    0   -
686  a  22.67   0.750  u  g   c   v  2.00  f   t    2   t   g  200.0  394   -
687  a  25.25  13.500  y  p  ff  ff  2.00  f   t    1   t   g  200.0    1   -
688  b  17.92   0.205  u  g  aa   v  0.04  f   f    0   f   g  280.0  750   -
689  b  35.00   3.375  u  g   c   h  8.29  f   f    0   t   g    0.0    0   -

[690 rows x 16 columns]
I have to fill the NA values of columns a2 and a14 using regression, in which a neural network is trained on the the following columns: ['s3','a8','a9','a10','a11','a12','a13','a15']. The idea is that a regression should provide better estimates than filling with the median value.
These are the steps that I followed:
- converted to one hot encoding the categorical columns
'a9','a10','a11','a12'. - normalization of the numerical columns
's3','a8','a11','a15'withscipy.stats.zscore - for
a2, extracted the rows in whicha2is not NA. Created a train/validation set. Created a neural network, trained it and predict over the validation set. - same for
a14.
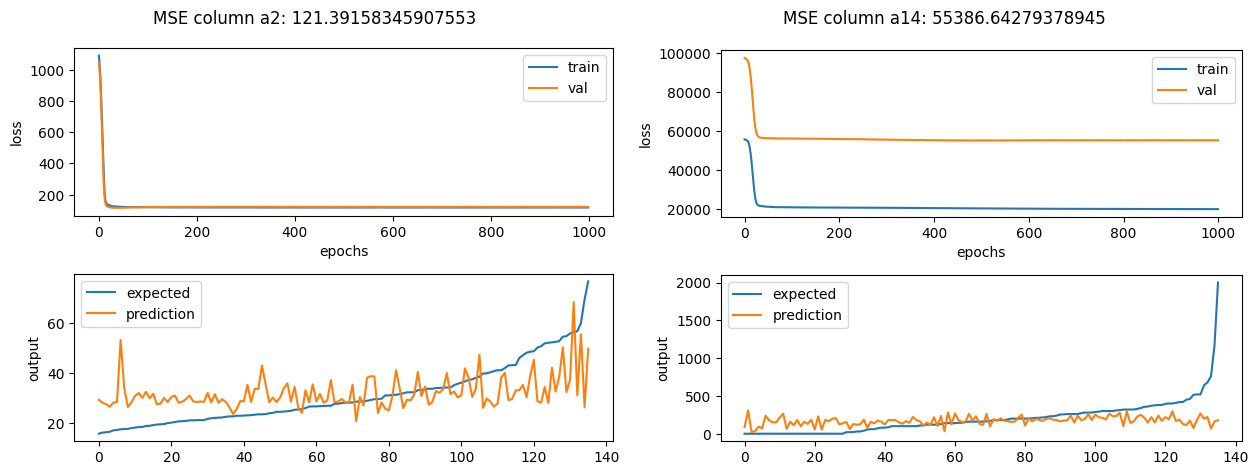
The problem is that my predictions are very poor: I've played with architecture (number of layers and neurons), loss functions, optimizers, batch size... Nothing seems to bring me close to a good estimate.
Since I'm new to machine learning, I probably did something wrong, but I need help in figuring out what. Here is the code and my results.
import pandas as pd
import numpy as np
import matplotlib.pyplot as plt
from scipy.stats import zscore
from tensorflow.keras.models import Sequential
from tensorflow.keras.layers import Dense, Activation
from sklearn.model_selection import train_test_split
from sklearn import metrics

def chart(history, pred, y, sort=True, title=None):
    # plot loss and prediction

    fig, ax = plt.subplots(2, 1)
    ax[0].plot(history.history['loss'], label="train")
    ax[0].plot(history.history['val_loss'], label="val")
    ax[0].set_xlabel("epochs")
    ax[0].set_ylabel("loss")
    ax[0].legend()

    t = pd.DataFrame({'pred': pred, 'y': y.flatten()})
    if sort:
        t.sort_values(by=['y'], inplace=True)
    ax[1].plot(t['y'].tolist(), label='expected')
    ax[1].plot(t['pred'].tolist(), label='prediction')
    ax[1].set_ylabel('output')
    ax[1].legend()
    if title:
        fig.suptitle(title)
    fig.tight_layout()
    plt.show()

df = pd.read_csv("https://data.heatonresearch.com/data/t81-558/crx.csv",na_values=['?'])
df_original = df.copy()

# one hot encoding
df = pd.concat([df,pd.get_dummies(df['a9'],prefix="a9")],axis=1)
df.drop('a9', axis=1, inplace=True)
df = pd.concat([df,pd.get_dummies(df['a10'],prefix="a10")],axis=1)
df.drop('a10', axis=1, inplace=True)
df = pd.concat([df,pd.get_dummies(df['a12'],prefix="a12")],axis=1)
df.drop('a12', axis=1, inplace=True)
df = pd.concat([df,pd.get_dummies(df['a13'],prefix="a13")],axis=1)
df.drop('a13', axis=1, inplace=True)

# normalization
df['s3'] = zscore(df['s3'])
df['a8'] = zscore(df['a8'])
df['a11'] = zscore(df['a11'])
df['a15'] = zscore(df['a15'])

# drop uneccessary columns
check = lambda t: any(s in t for s in ['s3','a8','a9','a10','a11','a12','a13','a15'])
df.drop([t for t in df.columns if not check(t)], axis=1, inplace=True)

def apply_regression(column):
    # select all rows where column is not NA
    idx = df_original[column].isna()
    x = df[~idx].values
    y = df_original[column][~idx].values

    x_train, x_test, y_train, y_test = train_test_split(
        x, y, test_size=0.2,
        random_state=42
    )

    model = Sequential()
    model.add(Dense(6, input_dim=x.shape[1], activation="relu"))
    model.add(Dense(3, activation="relu"))
    model.add(Dense(1))

    model.compile(loss='mean_squared_error', optimizer='adam')

    history = model.fit(
        x_train, y_train, validation_data=(x_test, y_test),
        verbose=0, epochs=1000, batch_size=16
    )

    # Plot the chart
    pred = model.predict(x_test)
    mse = metrics.mean_squared_error(pred, y_test)
    chart(history, pred.flatten(), y_test, title="MSE column {}: {}".format(column, mse))

apply_regression("a2")
apply_regression("a14")

