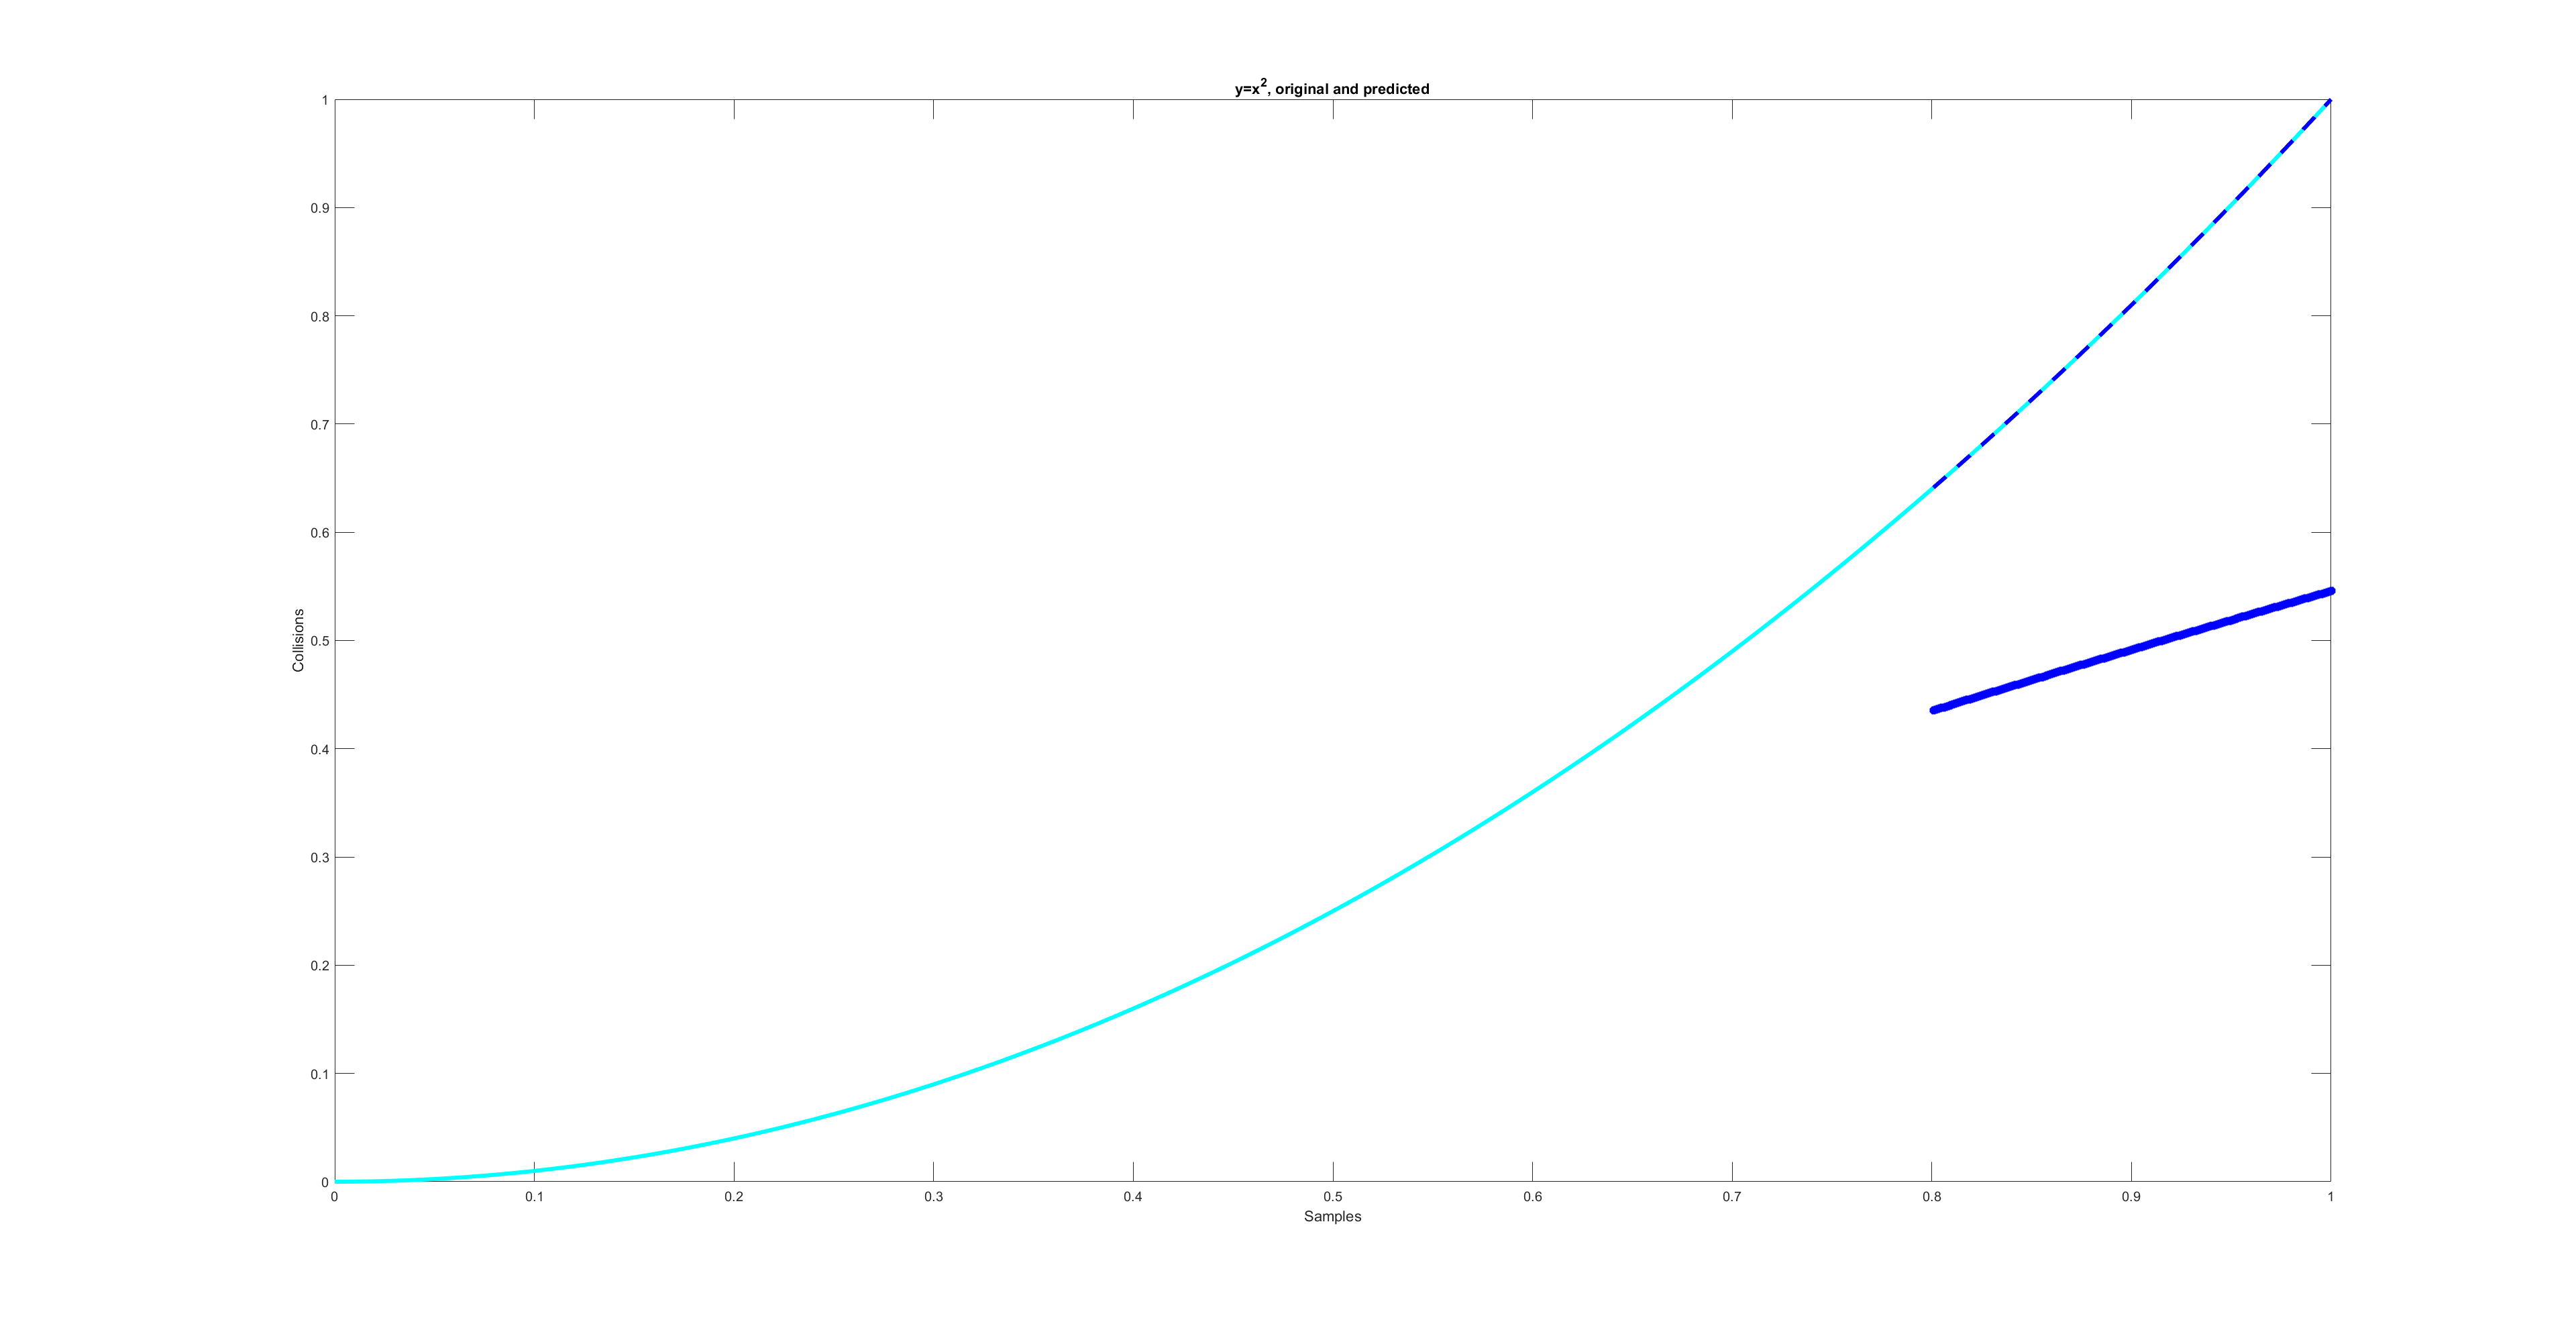
I was trying to get Tensorflow to model/predict y=x^2. After reading around, I gathered that using the tanh activation helps capture non-linearities. However, all I am getting are straight-line predictions no matter what I try. It is typically offset from the curve it should match, as well.
Please see the plot below for an example. Cyan is the original data (y=x^2), blue dashed is the test portion, while the rest of the cyan is training data. Solid, blue straight line is the output of model.predict
Any idea how I can better model and match non-linear data such as this?
Here is my code:
import numpy as np
import pandas as pd
import matplotlib.pyplot as plt
from tensorflow.keras.models import Sequential
from tensorflow.keras.layers import Dense, Dropout
from sklearn.preprocessing import MinMaxScaler
from sklearn.model_selection import train_test_split
import matlab.engine
from tensorflow.keras.callbacks import EarlyStopping
from tensorflow.keras.optimizers import Adam

# Parameters
myX = np.linspace(0, 10, 1000)
myY = np.zeros(len(myX))
for ii, x in enumerate(myX):
    myY[ii] = myX[ii] ** 2

myY_flattened = myY.flatten()
data = pd.DataFrame({
    'myX': myX,
    'myY': myY
})
print(data.head())

plt.plot(myX, myY)
plt.xlabel('X')
plt.ylabel('y')
plt.title('y=x^2')
plt.show()


# Normalize the features
scaler_inputs = MinMaxScaler()
myX_scaled = scaler_inputs.fit_transform(data['myX'].values.reshape(-1, 1))

scaler_outputs = MinMaxScaler()
myY_scaled = scaler_outputs.fit_transform(data['myY'].values.reshape(-1, 1))

# Split the data into training and testing sets
X_train, X_test, y_train, y_test = train_test_split(myX_scaled, myY_scaled, test_size=0.2,
                                                    shuffle=False)

# Print the shapes to verify
print(X_train.shape, X_test.shape, y_train.shape, y_test.shape)
print('*' * 50)

model = Sequential([
    Dense(128, input_dim=1, activation='tanh'),
    Dense(64, activation='tanh'),
    Dense(32, activation='tanh'),
    Dense(1)
])

optimizer = Adam(learning_rate=0.0001)  # Decrease the learning rate
model.compile(optimizer=optimizer, loss=['mse'], metrics=['mse'])

# Define early stopping callback
early_stopping = EarlyStopping(monitor='val_loss', patience=4, restore_best_weights=True)

# Train the model
history = model.fit(X_train, y_train, epochs=300, batch_size=32, validation_split=0.2,
                    callbacks=[early_stopping])

# Evaluate the model on the test set
test_loss, test_accuracy = model.evaluate(X_test, y_test)
print(f"Test Loss: {test_loss:.4f}")
print(f"Test Accuracy: {test_accuracy:.4f}")

# Make predictions on the test set
y_pred_scaled = model.predict(X_test)  # Predicted probabilities for each timestep in the sequence

# Reshape X_test back to 2D for inverse_transform
myX_orig = scaler_inputs.inverse_transform(X_test)
myY_orig = scaler_outputs.inverse_transform(y_test)

y_pred = scaler_outputs.inverse_transform(y_pred_scaled)

# Start MATLAB engine
eng = matlab.engine.start_matlab()

eng.figure(nargout=0)
eng.plot(myX, myY, 'c', 'Linewidth', 3, nargout=0)
eng.hold('on', nargout=0)
eng.plot(np.array(myX_orig[:, 0]), myY_orig, 'b--', 'Linewidth', 3, nargout=0)
eng.plot(np.array(myX_orig[:, 0]), y_pred, 'b*', 'Linewidth', 3, nargout=0)
eng.title('y=x^2, original and predicted', nargout=0)
eng.xlabel('Samples', nargout=0)
eng.ylabel('Collisions', nargout=0)

eng.figure(nargout=0)
eng.plot(myX_scaled[:,0], myY_scaled, 'c', 'Linewidth', 3, nargout=0)
eng.hold('on', nargout=0)
eng.plot(np.array(X_test[:, 0]), y_test, 'b--', 'Linewidth', 3, nargout=0)
eng.plot(np.array(X_test[:, 0]), y_pred_scaled, 'b*', 'Linewidth', 3, nargout=0)
eng.title('y=x^2, original and predicted', nargout=0)
eng.xlabel('Samples', nargout=0)
eng.ylabel('Collisions', nargout=0)

# Wait for all figures to be closed
eng.wait_for_figures(nargout=0)


