0
$\begingroup$

I'm an undergrad interested in machine learning, and I'm playing around with some data in order to get a better understanding of the field.

DATA

I'm working with the following data:

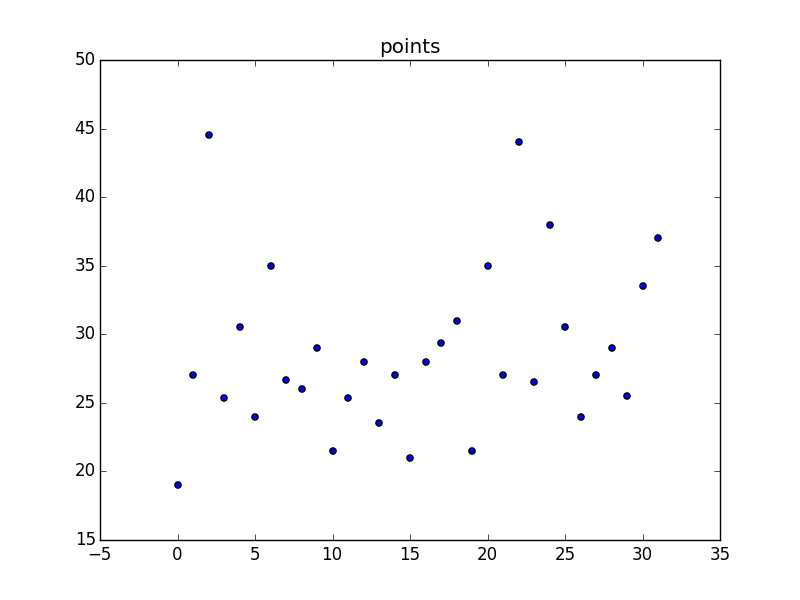
Regression plot

To give you an idea of what you're looking at (sorry for the unlabeled axes) -- each data point corresponds to a basketball player's points per game (y-values) over a one-week period (x-values).

END GOAL

I want to predict progress throughout the year, so in order to test/train, I start with the first two points, fit a regression model, and then predict the third point. I then add the actual value of the third point to the set, re-train, and predict the fourth point, etc.

ISSUES

As you can see, the data is all over the place, and the predictions are just as messy (sometimes getting up to ~200 points per game, which is totally impossible).

I've tested different degrees of linear regression (quadratic, cubic, etc.) and degree=1 is always the best predictor because of how wonky the data is.

IDEAS

I have thought of the following ways to get more accurate predictions:

  • Smoothing the data, maybe using a moving average or some variant
  • Set an upper limit for predictions
  • Non-linear regression

But outside of smoothing the data, I'm not sure if the rest are even possible in a regression model (upper limit) or applicable to this situation (non-linear).

QUESTION

Are any of the ideas I had above worth pursuing? If not, is there anything I should look into that might help me solve this problem?

Thanks!

$\endgroup$
6
  • 1
    $\begingroup$ I think this is a bit of a lost cause - sorry. There is no point smoothing the data since you don't have noise in your measurements. Setting an upper limit for predictions is just arbitrary, and using non-linear regression could fit your data perfectly with a sufficiently high-order polynomial, but would be hopeless at predicting (generalising) a trend. With the data that you have, the best you could hope for is (perhaps) a vaguely increasing trend over time, but any predictions would have a large error. $\endgroup$
    – DrMcCleod
    Commented Jul 27, 2016 at 20:42
  • $\begingroup$ Your data consists of only time and the variable you want to predict? Do you have many observations? Before applying an ARIMA model, I would start to find trends in your data. Maybe they play worse in the winter than the summer? Maybe they play better on Fridays? You have to try to add more variables into the mix. $\endgroup$ Commented Jul 28, 2016 at 10:58
  • $\begingroup$ If you have a lot of observations, you could try to reframe the problem a little, and use a quantile regression to see if there are patterns within which you can predict with higher confidence. For instance, maybe you can predict the next score very well if it has been increasing. Maybe start with something simpler like a logistic regression to tell you whether in the next game score will go up or down. But anyhow, you should to try to add more variables like what kind of game or championship it is, what players are playing, against whom... $\endgroup$ Commented Jul 28, 2016 at 11:03
  • $\begingroup$ Thanks for your input @RicardoCruz -- I think I'll start looking at logistic regression and then check out quantile regression. Would binary variables like is_friday (as you suggested) potentially increase accuracy, or does regression require a continuous value as a feature? $\endgroup$
    – Chris
    Commented Jul 29, 2016 at 16:53
  • $\begingroup$ @Chris, you have a problem that sounds to me as difficult as the stock market. Stock markets look almost random, because if they were easily predictable, everybody would try to predict them. Your problem looks just as difficult, which is why I suggested classification/logistic. It is my understand that is a little easier to predict whether it goes up or down (and you should buy or sell) than the specific price. This wikipedia article seems to corroborate that (search for "[2]"). $\endgroup$ Commented Jul 30, 2016 at 10:19

1 Answer 1

0
$\begingroup$

You have little features (as in none hehe). Your data reminds me a lot of stock market predictions, where you know nothing about what you're studying except for price. Furthermore, price behaves chaotically, because if it was easily predictable, then everybody would be predicting it, thus removing its predictability.

Therefore, if you are serious about studying that data, you may want to look up literature on stock market prediction.

I suggested in a comment that one approach could be to see this as a classification problem rather than a regression problem. This is in fact what many people do in the stock market. Instead of predicting actual price, people study whether the price will go up or down (and therefore whether they should buy or sell).

Here is an example of what I mean, implemented in sklearn:

import numpy as np
import matplotlib.pyplot as plt
from sklearn.cross_validation import cross_val_score
from sklearn.linear_model import LogisticRegression

# random signal
n = 100
t = np.arange(n)
x = np.random.rand(n)
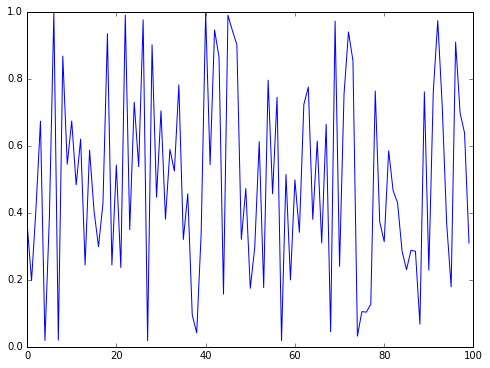
plt.plot(t, x)
plt.show()

random signal

# model ups and downs: convert to 0s (down) and 1s (up)
t = t[1:]
y = ((np.sign(x[1:] - x[:-1])+1)/2).astype(int)
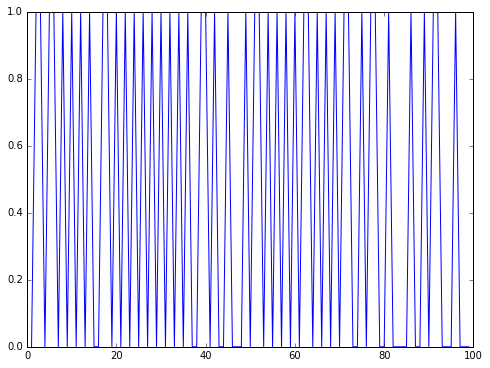
plt.plot(t, y)
plt.show()

ups and downs

# one look-ahead model using the four previous observations
X = np.c_[y[:-4], y[1:-3], y[2:-2], y[3:-1]]
y = y[4:]
scores = cross_val_score(LogisticRegression(), X, y, cv=10, n_jobs=-1)
print('Acc: %.2f (%.2f)' % (np.mean(scores), np.std(scores)))

My results:

Acc: 0.75 (0.17)

One advantage of this approach is that it gives you probabilities of going up or down. Remember, a logistic regression is a probabilistic model $P(y|x)$, and here we are taking $P(y|x)<0.5$ to mean down and $P(y|x)>0.5$ to mean up. But if the probability is close to 0.5, you could have your model say "I don't know". This way you only take action when the model reports down or up with high confidence (close to 0 (down) or 1 (up)). A colleague of mine wrote his thesis on this kind of thing. Are you trying to model sports in order to place bets? If so, this is a pretty simple but effective model of choosing when it is worthy to place bets.

But if the idea is to learn about data mining, then I would try another dataset.

$\endgroup$
1
  • $\begingroup$ Thank you so much for your reply! This is great information and the example is very helpful. I think the stock market analogy is very true, and I'll start reading more about data science/machine learning in that field. $\endgroup$
    – Chris
    Commented Jul 30, 2016 at 16:11

Your Answer

By clicking “Post Your Answer”, you agree to our terms of service and acknowledge you have read our privacy policy.

Not the answer you're looking for? Browse other questions tagged or ask your own question.