2
$\begingroup$

I'm trying to fit a rotated parabola with curve_fit, but it doesn't fit well as shown below:

Rotated parabola and fitted line with curve_fit

I'm already trying to fit the curve with respect to the cos(𝜃) and sin(𝜃) dependency as follows:

def rotated_parabola(x, a, b, c, theta):
    # Original parabola
    y = a * x**2 + b * x + c

    # Rotate the parabola
    x_trans = x * np.cos(theta) - y * np.sin(theta)
    y_trans = x * np.sin(theta) + y * np.cos(theta)
    return x_trans, y_trans

Any insights as to why this isn't fitting well would be much appreciated, alternatively if there are any existing libraries which can solve this would be great too!

Thanks in advanced.

$\endgroup$
1
  • $\begingroup$ Hard to say without seeing the rest of your code but from the looks of things, it might be attempting to model f(x)=y when the actual relationship of your transformed data is f(y)=x. $\endgroup$ Commented Nov 1 at 20:27

2 Answers 2

3
$\begingroup$

The approach below fits to a rotated parabola.
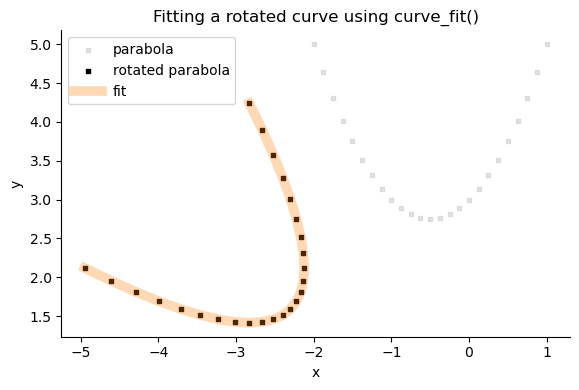
enter image description here

I estimate the coefficients $A, B, C$ by first removing the rotation (rotate $-\theta$). Then I plug in the coefficients of a regular parabola, and finally rotate the result back.

I give curve_fit() both the $x$ and $y$ coordinates (your code only supplies $x$ to the model).

The model function rotated_parabola() does the following:

  1. Assume $x, y$ are in rotated space. Undo the rotation on $x$ by applying $-\theta$ to $x$.
  2. Now it's a regular parabola, where we estimate $A, B, C$.
  3. Rotate the estimated $y$ back to the original orientation by applying $\theta$.

Reproducible example

import numpy as np
from scipy.optimize import curve_fit
from matplotlib import pyplot as plt

np.set_printoptions(suppress=True)

#
# Synthesise test data
# It's a parabola defined by A, B, C, which is then rotated by THETA
#
THETA = 45 * np.pi/180
A, B, C = (1, 1, 3)

#Generate the parabola defined by A, B, C
data_x_parab = np.linspace(-2, 1, num=25)
data_y_parab = A * data_x_parab**2 + B * data_x_parab + C

#Rotate the parabola by THETA
data_xy = (data_x, data_y) = (
    np.row_stack([
        (np.cos(THETA), -np.sin(THETA)),
        (np.sin(THETA),  np.cos(THETA))
    ])
    @ np.row_stack([data_x_parab, data_y_parab])
)

def rotated_parabola(xy, theta, a, b, c):
    x, y = xy

    #First, apply -theta to reverse the rotation
    x_parabola = x * np.cos(-theta) - y * np.sin(-theta)

    # Parabola equation is now valid
    # Fit the parameters (a, b, c) of the parabola
    y_parabola = a * x_parabola**2 + b * x_parabola + c

    # Rotate the fitted point back into the original space
    y_fit = x_parabola * np.sin(theta) + y_parabola * np.cos(theta)
    return y_fit

#Fit
popt, pcov = curve_fit(rotated_parabola, data_xy, data_y)
print(
    'Data parameters:', THETA * 180/np.pi, A, B, C, '\n'
    'Fitted parameters:', round(popt[0] * 180/np.pi), *popt[1:].round(1)
)

#
# Plot data
#
f, ax = plt.subplots(figsize=(8, 4), layout='tight')

#Data
ax.scatter(data_x_parab, data_y_parab, marker='s', s=12, alpha=0.1, color='black', label='parabola')
ax.scatter(data_x, data_y, marker='s', s=12, color='black', label='rotated parabola')

#Plot the fitted curve
y_fitted = rotated_parabola(data_xy, *popt)
ax.plot(data_x, y_fitted, color='tab:orange', linestyle='-', linewidth=7, alpha=0.3, label='fit')

#Formatting
ax.legend()
ax.spines[['top', 'right']].set_visible(False)
ax.set(xlabel='x', ylabel='y', title='Fitting a rotated curve using curve_fit()');
ax.set_aspect('equal')
$\endgroup$
0
$\begingroup$

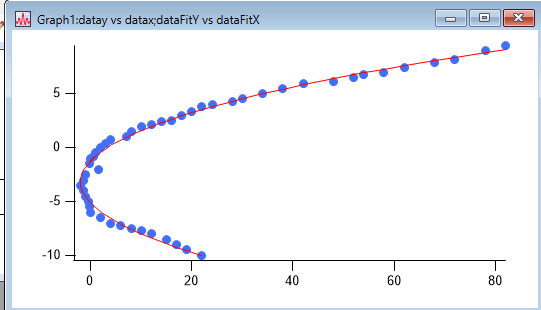
Here's how you do it in Igor Pro (https://www.wavemetrics.com/) assuming an x-wave named datax and a y-wave name datay:

  1. Add the following function to your Procedures
Function fitRotatedParabola(Wave w, Variable x, Variable y) : FitFunc
    Variable a = w[0]
    Variable b = w[1]
    Variable c = w[2]
    Variable t = w[3]

    //CurveFitDialog/
    //CurveFitDialog/ Coefficients 4
    //CurveFitDialog/ w[0] = a
    //CurveFitDialog/ w[1] = b
    //CurveFitDialog/ w[2] = c
    //CurveFitDialog/ w[3] = t
    
    return a * (x * cos(t) - y * sin(t)) * (x * cos(t) - y * sin(t)) + b * (x * cos(t) - y * sin(t)) + c - x * sin(t) - y * cos(t)
End
  1. Create a coefficient wave as starting points for a, b, c, and theta:
Make /D /O rotatedParabolaCoefs = {2, 3, 3.5, 1.57079}
  1. Duplicate the x and y waves to give the fit results somewhere to live:
Duplicate /O datax dataFitX
Duplicate /O datay dataFitY
  1. Run the fit:
FuncFit /ODR=3 fitRotatedParabola, rotatedParabolaCoefs /X={datax, datay} /XD={dataFitX, dataFitY}
  1. Graph the results:
Display datay vs datax
AppendToGraph dataFitY vs dataFitX
ModifyGraph mode(datay)=3, marker(datay)=19, rgb(datay)=(1,16019,65535)

Resulting graph

$\endgroup$

Your Answer

By clicking “Post Your Answer”, you agree to our terms of service and acknowledge you have read our privacy policy.

Not the answer you're looking for? Browse other questions tagged or ask your own question.