An association rule is (usually) of the format X -> Y, meaning that if X happens then Y is likely to happen. In the traditional example of supermarket, a possible rule would be something like Bread -> Butter. In this case, X is called the antecedent, or LHS (left-hand side), and Y is the consequent, or RHS.
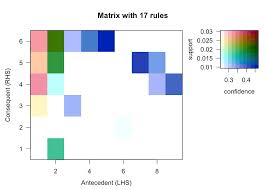
This specific chart has the number of items in the LHS as it's horizontal axis, and the number of items in the RHS as the vertical axis. The colors represents the metrics of support and confidence, as can be seen in the legend.
Example information that can be read from this chart is that the support is higher for lower number of items in the LHS, because the left side of the chart looks red-ish and the right side looks blue-ish, matching our intuition (more items in the LHS is more restrictive and thus less likely to happen). The confidence doesn't seem to be related to any of the axes in particular.

