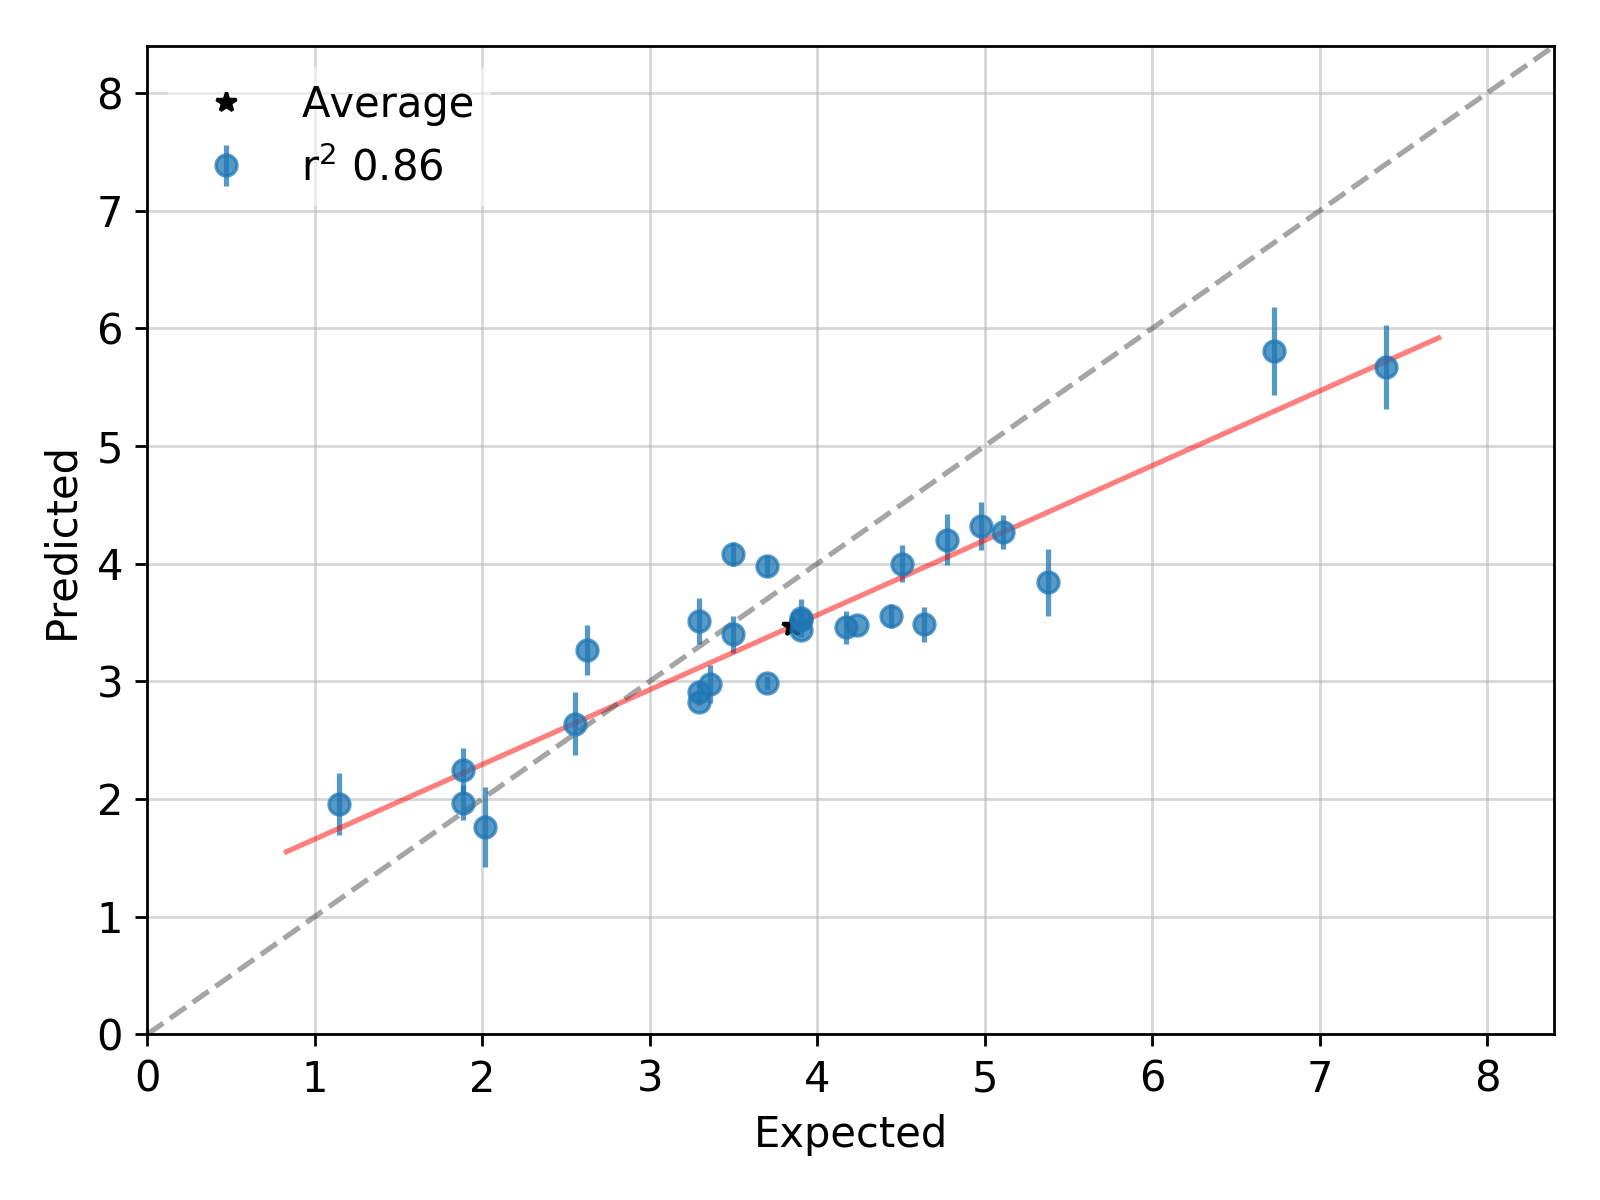
OK, we have two dozen predictions-with-uncertainty, and actual point values. I'm still not sure we know enough to answer, so I'm going to just outline some points and hope someone can improve upon this. A quick search found three similar StackExchange questions:
- Combining 13 independent regressions seems the most similar -- Note comment warning this might be meaningless. The best-answer suggests a sampling approach because the result has no closed form. Using a Normal approximation would have a closed form, but I think your plot suggests the errors are not Normal, or your 95% CI is much too narrow.
- Combining 2 -- See esp. the reply discussing meta-analysis and whether you have a fixed effects or a random effects model. This may be what you are doing, in which case re-formulating the question for that community may be best.
- Delta Method -- Seems to me the same question, but takes a direct maximization approach, assuming approximations hold.
A couple of observations suggesting any simple average is not going to give you what you want, and you need to be very clear what is being combined, and what question the result is going to answer:
If these are 95% Confidence Intervals, then your error model is much too conservative. Nearly all of them should include the true value (gray dashed diagonal) but only about 5 do. Therefore any parametric combination will be at least as unreliable. But suppose you have a black box with uncalibrated estimates, and you just want to know the "average" from that black box, however uncalibrated.
If these are two-dozen unrelated estimates from a crowdsourcing platform, the "average" is not meaningful. On the other hand, if they are performance measures of the crowd, then the average is something like the average performance of the crowd across all question types. In that case:
- 1st approximation would just average the two-dozen points and use the standard deviation of that. (Each point can be weighted.)
- 2nd approximation would treat each estimate and CI as Normal, and use one of the formulas for combining Normal CIs. Note however that it seems error bars are wider towards the edges. That may require special handling.
- 3rd approximation: sample say 100 forecasts from the two-dozen distributions and then combine those ~2400 samples. (Weighting can be done by varying sample size for each forecast.) Works even if the distributions are not assumed to be Normal.
If instead you have two-dozen forecasts from a single statistical model on different input data, and you want to know the average forecast across all input combinations, don't combine them. Just run the model with no factors specified, and use that result.
Hopefully a bona fide statistician can supply a more definitive answer.

