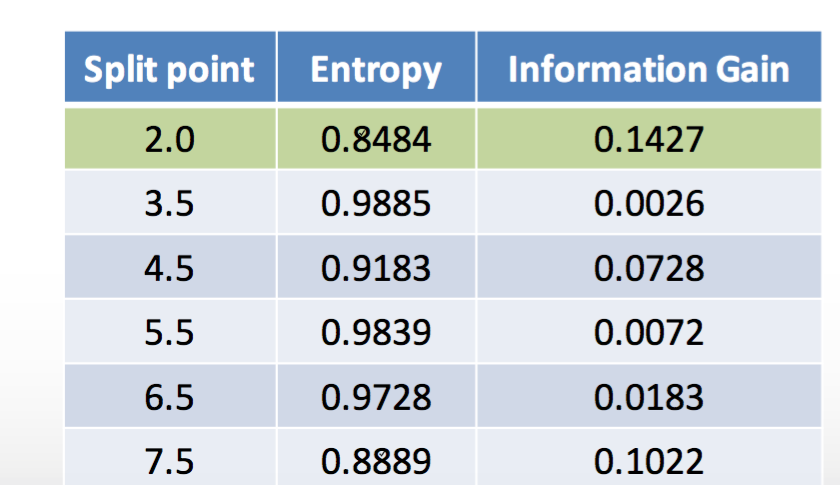
In decision trees, the (Shannon) entropy is not calculated on the actual attributes, but on the class label. If you wanted to find the entropy of a continuous variable, you could use Differential entropy metrics such as KL divergence, but that's not the point about decision trees.
When finding the entropy for a splitting decision in a decision tree, you find a threshold (such as midpoint or anything you come up with), and count the amount of each class label on each size of the threshold. For example:
Var1 | Class
0.75 | 1
0.87 | 0
0.89 | 1
0.96 | 0
1.02 | 1
1.05 | 1
1.14 | 1
1.25 | 1
Let's assume a threshold of 0.99 because I want two equal-sized bins and that's the midpoint between 0.96 and 1.02. The classes on the left are [1, 0, 1, 0] (since it's half/half, entropy is 1.0), and on the right [1, 1, 1, 1] (since it's all equal, entropy is 0.0).
To make a table like the one you show here, you need to define N threshold points (2.0, 3.5, ..., 7.5, in your case), which will produce N+1 bins of data, you take the class of each bin and calculate the entropy. A more correct visualization to your table should be changing the "Split point" values to "2.0 or lower", "Between 2.0 and 3.5", "Between 3.5 and 4.5", ..., "7.5 or higher".
Note this all applies to classification (decision) trees, and not regression trees, where the "class" is actually a continuous variable.

