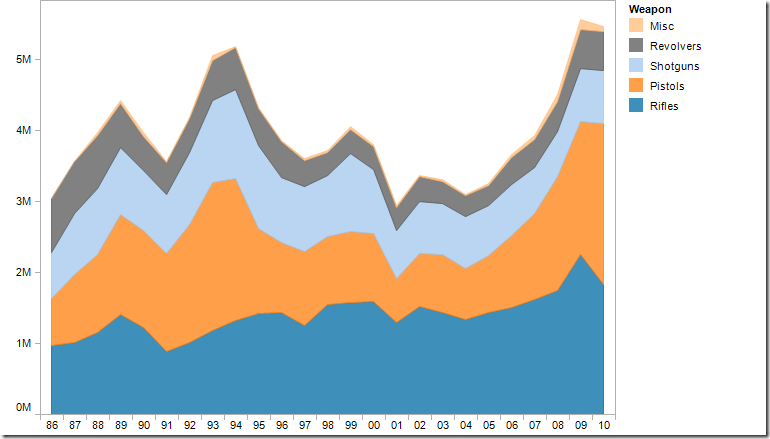
In pandas I can set the date as index, and then run df.plot() to see a line chart. How do I make that line chart stacked as in the picture below?
1 Answer
3
-
$\begingroup$ Np. The keyword you may have left out was “area”, but honestly I’m not sure how I remembered that’s what these plots are called. $\endgroup$– kbroseCommented Apr 18, 2018 at 13:51
-
$\begingroup$ Do you know how I would do if I would add a group D to that plot from python-graph-gallery, and group D should not be stacked i.e. just a regular line? $\endgroup$– jacobCommented Apr 18, 2018 at 14:00
-
$\begingroup$ df.plot.area() returns the matplotlib axis object, just call ax.plot(my_data) $\endgroup$– kbroseCommented Apr 18, 2018 at 15:46

