0
$\begingroup$

I am studying normalized graph cuts, and one of the way to define weight matrix is using heat kernel, which is $W_{ij} = e^{\frac{−∥x_i − x_j∥^2}{σ^2}}$.

I want to ask: what's the meaning of sigma? Does it affect on the partition of the data? How do we pick sigmas? And what happens if its too large or too small?

What happens to the Laplacian matrix L as $\sigma → 0$ and $\sigma → \infty$? What are the eigenvectors and eigenvalues of this matrix?

$\endgroup$
0

3 Answers 3

1
$\begingroup$

$\sigma$ represents a typical distance between points. If all points of one cluster of your graph are separated from all points of another by a distance that is significantly higher than $\sigma$, then the spectral clustering will probably use this as a cut.

If you already know the number of clusters (or cuts) that you want to make, $\sigma$ does not need to be tuned very finely. But it becomes really important if you have no idea how many cuts you want to make.

A good approach is to make a parametric study over $\sigma$, and make the decision through the eigen values. Here's an example from one of my study cases, giving eigen values (in ascending order) of the Laplacian matrix, for 4 different values of $\sigma$:
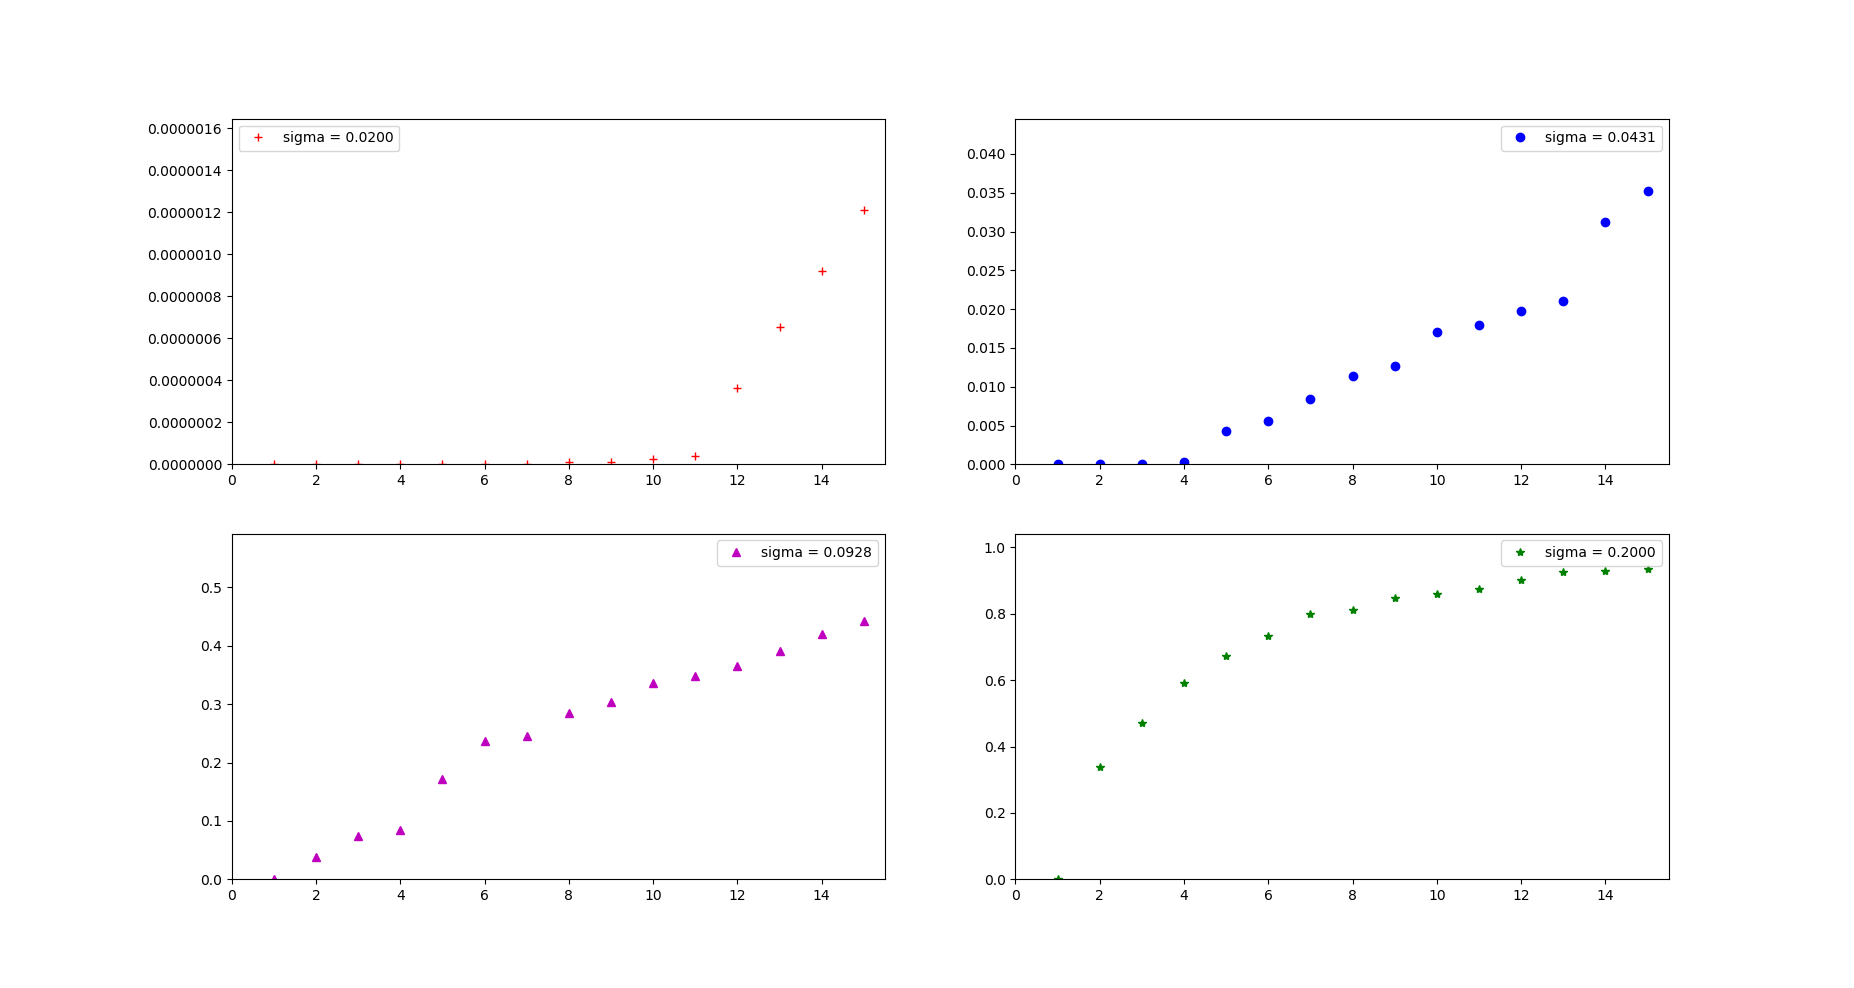
Spectral analysis for everal sigmas

What you are looking for is a break in the increase of eigen values: theoritically, a wide gap between two consecutive values ($n$ and $n+1$) should tell you that it is a good idea to make $n$ clusters.

As you can see, small sigma values (upper left plot) lead to very low eigen values, sometimes even numerically negative. Very small values tend to make very small clusters containing outliers, and a very big cluster with all other points. High sigma values (lower right plot) will make your matrix look like the identity, with high eigen values, this usually won't bring anything interesting.

What I usually do is try a wide window for sigma values, and shorten the range progressively, until I find a satisfying result. This is all graphical, and depends on the prior knowledge about your problem (how many clusters do you approximately expect? 2, 10, 100?).

Eigen values represent the quality of the cut. Small values correspond to very distant clusters. For instance, in my upper right case, I could make 4 very well separated clusters (first 4 eigen values are almost 0). The next cut (to reach 5 clusters) would be less effective than the 3 previous ones. 13 clusters could also have been a good try. But I actually selected 9 clusters, because it was closer to what I actually expected.

$\endgroup$
0
$\begingroup$

$\sigma$ is the way you measure similarity in your data. If $\sigma$ is almost $0$, then you similarity matrix is basically the identity matrix, and you won't be able to extract anything.

But same if you use big $\sigma$. In that case, your similarity matrix is uniform. And this doesn't create a good classification either.

Spectral clustering works by projecting your original data in an embedded space. This works by using these similarities to create a good embedded space. It is then a compromise, so that only local, close samples have a similarity different from $0$. If you have a too big $\sigma$, you end up with shortcuts in your manifold, and your embedded space will make samples that should be far too close.

$\endgroup$
0
$\begingroup$

$\sigma$ is the standard deviation of the Gaussian distributions. Your "heat kernel" is a Gaussian, but missing the normalization factor (removing a global scaling constant is likely fine, but it makes it less obvious where this equation comes from).

It is a quite important parameter, but you have to set it yourself. It depends on your data and assumptions.

If you set the bandwidth to large, everything is uniformly connected and there are no meaningful cuts. If you set it too small, then everything is disconnected and you have N clusters of 1 element each. Neither works for clustering.

As a first guess, you could look into the heuristics used in statistical kernel density estimation, such as Silverman's rule of thumb. These may, or may not, be appropriate for your data. Plus, that rule will give you a different sigma for each variable (for a good reason).

$\endgroup$
3
  • $\begingroup$ There are no Gaussian distributions here. It's a similarity measure, not a probability (note that there is no scaling factor to the exponent). And if sign is small, there is no connection, it's not uniformly connected. It's the opposite of what you are saying. $\endgroup$ Commented Oct 25, 2018 at 10:26
  • $\begingroup$ Look at the Gaussian probability density function. Then you'll see where the sigma comes from. $\endgroup$ Commented Oct 26, 2018 at 8:17
  • $\begingroup$ I know perfectly well the Gaussian distribution, thank you very much. After all, I had to point you what it meant so that you could fix your post! $\endgroup$ Commented Oct 26, 2018 at 8:17

Your Answer

By clicking “Post Your Answer”, you agree to our terms of service and acknowledge you have read our privacy policy.

Not the answer you're looking for? Browse other questions tagged or ask your own question.