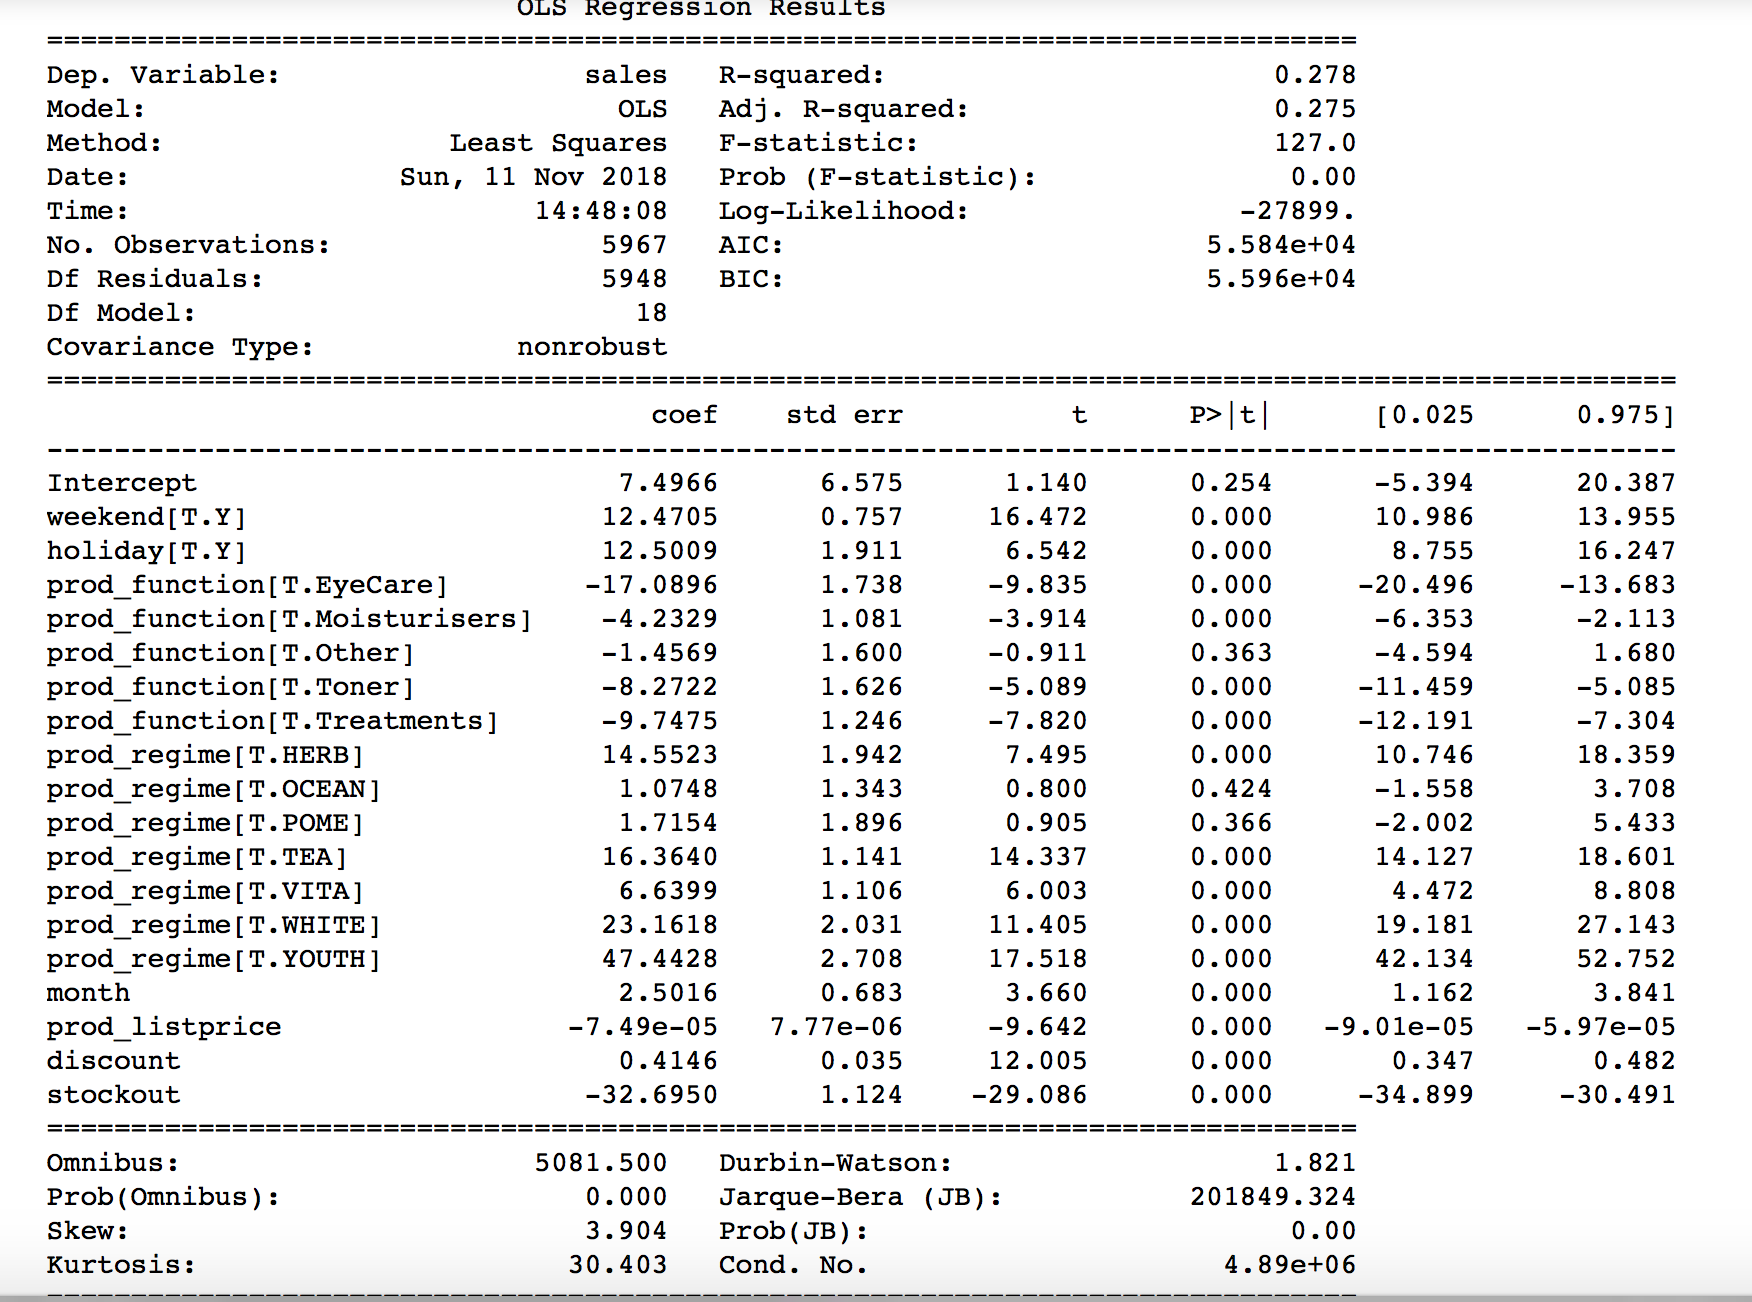
There are a lot going on in a simple OLS model. I strongly encourage you to learn more about them from textbooks. One of the best place to start is the free online book An Introduction to Statistical Learning (see Chapter 3 about Regression, in which it explains some of the elements in your model summary).
Also in this blogpost, they explain all elements in the model summary obtained by Statsmodel OLS model like R-Squared, F-statistic, etc (scroll down). There are also series of blogposts in blog.minitab, like this one about R-Squared, and this about F-test, that explain in more details each of these elements. You can even explore more and learn about Residual Plots for post analyses of your regression models (important one to check).
Please note, you do not often need to have all these elements to examine a regressor model (some of them like BIC or F-stat are just not that informative, unless someone explicitly ask for them).
The first table i.e. overall model statistics, you can learn about:
R-Squared, which is an estimate of the strength of the relationship between your model and the response variable that lies between 0 (worst) and 1 (best), is 0.278 for your model. While from experience this is quite low, but one can not jump into a conclusion by simply only looking at only R-Squared! I think you can still do better.
F-Stat: It is a statistical test that compare the fit of the intercept-only model with your model. In simple works, if P value for the F-Stat (here Prob (F-Statistic) is less than your significance level, one can reject the null hypothesis that a intercept-only model is better, meaning your model is better a better job (Not a big surprise honestly).
The second table i.e. summary of statistics of your model breakdown:
Gives a lot of information about each variable. Each coefficient with its corresponding standard error, t-statistic, p-value. For instance, for each coefficient if the t-statistic is large (or simply the p-value is ZERO or very very small < 0.05), that particular coefficient is trustworthy like discount or stockout, otherwise the error is large and unlikely any interpretation from them to be reliable like some of the sublevels of prod_function or prod_regime categorical variables in your model. *Just a rough thought about these variables in your model, maybe the type of categorical encoding you do on these is not performing well, that is why the errors here are large?!
How To Interpret Your Model:
This is an interesting part. Taking that your model is good enough (within the defined confidence interval), one can find out how each of these variables contribute to the dependant variable (herein sales). Read more about how Interpreting Regression Coefficients or see this nice and simple example.
Specifically for the discount variable, if all other variables are fixed, then for each change of 1 unit in discount, sales changes, on average, by 0.4146 units (the coefficient of the discount from your model).
Hope these points get you started!


