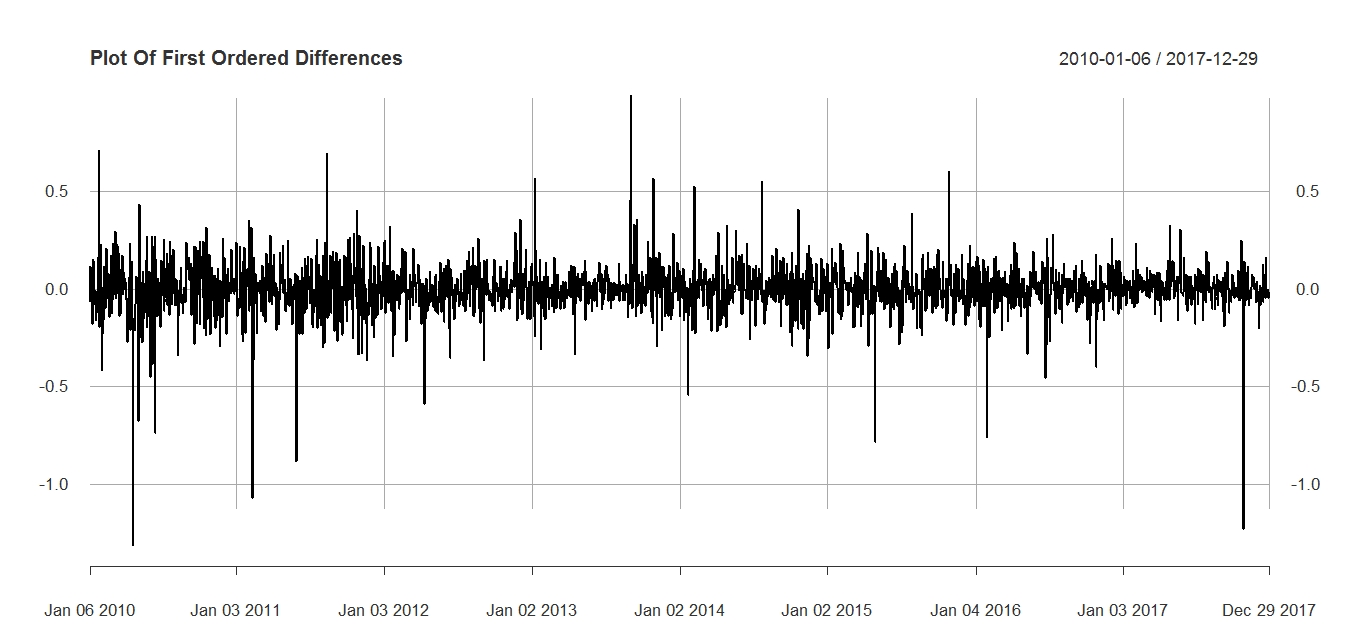
Is the above graph a white noise? I'm confused by the spikes at certain places. The above plot has been obtained after doing a first order differencing on a time series. How can I justify whether there is seasonality present/absent in the data after differencing?
2 Answers
How can I justify whether there is seasonality present/absent in the data after differencing?
Plot the amplitude of the Fourier transform of the signal.
If there is seasonality, you will see a peak at the appropriate frequency on the Fourier plot. This should be close to the plot's origin, because seasonality means slow changes and thus low frequencies.
-
$\begingroup$ I obtained a periodogram but there are many peaks at different frequencies but no particular peak stands out from the rest. $\endgroup$– Jor_ElCommented Apr 22, 2019 at 21:07
-
There are several ways to identify seasonal cycles in time series data.
First, if the seasonal pattern is very clear, you may be able to detect it in a plot of the time series (time = t on the X axis; X at time t on the Y axis).
Second, you can obtained a lagged autocorrelation function. For example, if each data point represents a measure for one month, and there is a 12 month cycle, a graph of the lagged autocorrelation function should show a relatively large positive autocorrelation at lag 12, with smaller peaks at lags 24 and 36 (if larger number of time lags are examined).