2
$\begingroup$

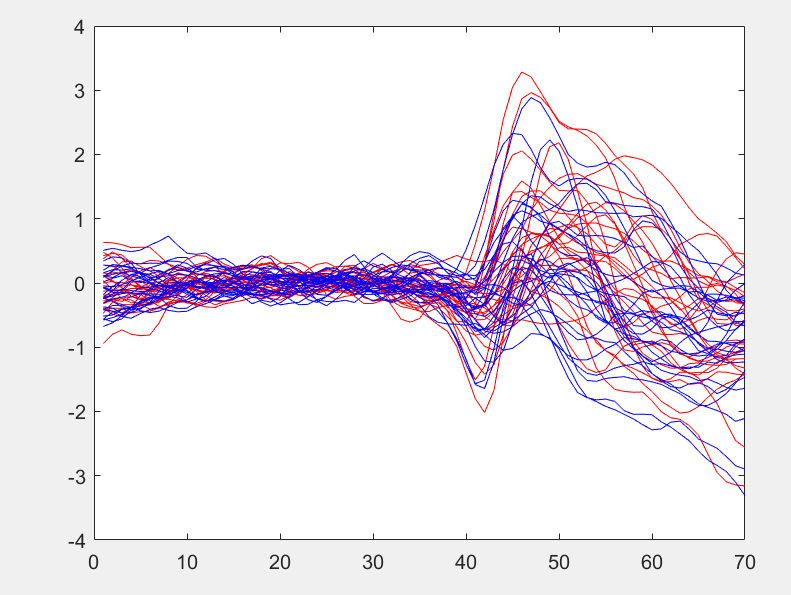
I have an experiment in which it was done under two conditions. For each condition, the experiment was performed 26 times. The output of the experiment is a plot with 70 time indices. I would like to train a classifier to predict, given a plot, to which condition it belongs. The image below shows the output of the conducted experiment under the two conditions recognised by different colors. The actual experiment begins at index 35, and thus it can be seen there is no difference in the outcome of the experiment before that regardless of the condition. The plots represent power spectral density of EEG from one channel (electrode).

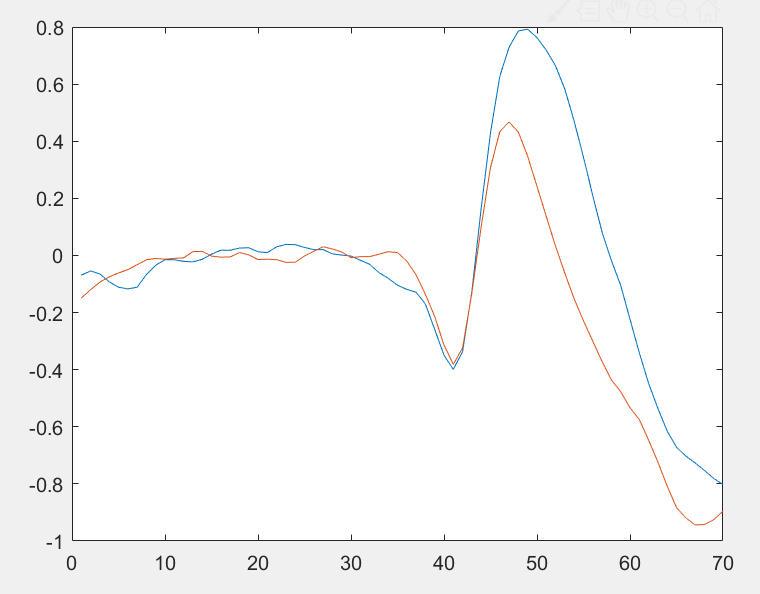
I am trying to train an svm classifer ignoring the features below 35. The classifier is having hard time doing so considering the high variability of each condition. One thing is, averaging the red plots and blue plots yield a noticeably different behaviour, as can be seen from the second figure. I would like to improve the accuracy of my classifier, beyond 65%. Is LSTM suitable for this type of problem? Any other suggestions? X_axis: time (ms), Y_axis: amplitude
Means of each category

$\endgroup$
4
  • $\begingroup$ Is it possible to have some information on the physical nature of the experiment so as to have a better understanding? That will help in giving you some constructive feedback. $\endgroup$ Commented May 6, 2019 at 4:29
  • $\begingroup$ The plots represent power spectral densities of EEG data. I edited the question to clarify that $\endgroup$
    – HaneenSu
    Commented May 6, 2019 at 4:35
  • 1
    $\begingroup$ Hmm... if its PSD of EEG on a single channel, I don't think simply feeding this data to any ML algorithm will not give you any sensible results. From what I understand, that it is an around the normalised frequency beyond 35 (x-axis) the EEG signature is prominent. Physically this simply means the major signal power is at those frequencies. I would rather suggest building some nice frequency related features rather than go for LSTM or even simply feeding in the psd to any ML. You should also use other channels like C1/C2 or even PO3 depending on the type experiment to do a classification. $\endgroup$ Commented May 6, 2019 at 11:29
  • $\begingroup$ Thanks for the recommendation. The experiment was done 96 times for each subject under each condition, averaging out trials improves the SNR and I have done that. The other thing is I am testing the SVM classifier on 58 channels separately, however, many of the channels are irrelevant. I identified 5 to 6 channels which are performing relatively good. They reach mean accuracy of 60%. I am trying to improve my accuracy. Additionally, I am focusing on one frequency band as the rest of the bands seems irrelevant. Note that x-axis is time while y-axis is PSD of certain frequency band. $\endgroup$
    – HaneenSu
    Commented May 6, 2019 at 12:49

1 Answer 1

1
$\begingroup$

A quick answer is since you have time series data, LSTM is generally appropriate if you would like to model/exploit time dependencies between values in each series. LSTMs are now combined with CNNs for even better performance. You can refer to this Q&A for that: What is the best method for classification of time series data?Should I use LSTM or any other method. The only problem is that it appears that you have an extremely small dataset, which normally leads to overfitting with neural networks given the number of parameters they need to compute. And there is actually a lower bound on the number of training samples needed for LSTM (see: Number of parameters in an LSTM model). Perhaps you can find pre-trained RNNs/LSTMs trained on similar data that you can use.

In general, any classification algorithm (especially those that perform well on time series data) can (and probably should) be tried. With SVM, I hope you've tried different kernels. There is at least this one paper that discusses the relative merits of different SVM kernels for time series analysis: http://www-ai.cs.uni-dortmund.de/EVENTS/FGML2001/FGML2001-Paper-Rueping.pdf.

If you have not already done so, I also recommend that you research feature extraction strategies for time series data (and particularly, EEG data) that have worked for others. There is at least one Q&A on this topic on the Cross Validated site: https://stats.stackexchange.com/questions/66027/time-series-classification-very-poor-results.

$\endgroup$
2
  • $\begingroup$ The experiment was actually done 96 times for each subject under each condition. I have reasonably good number of trials (24*2*96). However, I averaged over the trials for each subject as the SNR is moderate. Additionally, I tried RBF kernel (with optimized C and Gamma values) and linear kernel $\endgroup$
    – HaneenSu
    Commented May 6, 2019 at 8:44
  • $\begingroup$ I was trying to build a keras model of Lstm, however I am having hard time understanding how to feed in my data in an appropriate form $\endgroup$
    – HaneenSu
    Commented May 6, 2019 at 8:46

Your Answer

By clicking “Post Your Answer”, you agree to our terms of service and acknowledge you have read our privacy policy.

Not the answer you're looking for? Browse other questions tagged or ask your own question.