2
$\begingroup$

I am working on a binary classification where I have 4712 records with Label 1 being 1554 records and Label 0 being 3558 records.

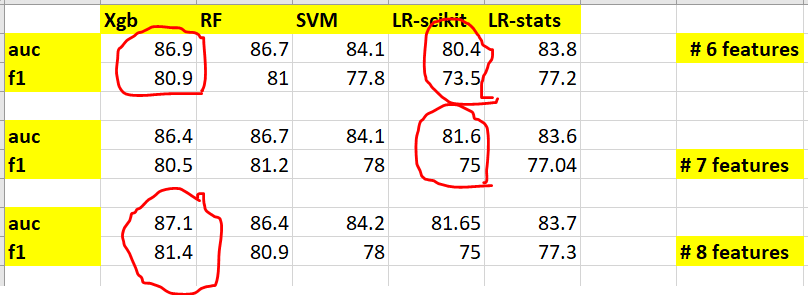
When I tried multiple models based on 6,7 and 8 features, I see the below results. Based on the newly added 7th or (7th & 8th) feature, I see an AUC improvement only in one of the models (LR scikit and Xgboost).

I also come across articles online that says AUC or F1-score aren't strict scoring rules. We could use log-loss metric but it's only applicable for logistic regression. but we can't use log-loss metric for Xgboost or RF or SVM right? So, is there any common metric which I can use to compare. Am I missing something here?

enter image description here

Does this mean that new feature is helping us improve the performance? But it decreases the performance in other models?

Please note that I split the data into train and test and did 10 fold CV on train data.

So, how do I know that this newly added 7th feature is really helping in improving the model performance?

update based on answer

from statsmodels.stats.contingency_tables import mcnemar
# define contingency table
table = [[808,138],    # here I added confusion matrix of two models together (I mean based on TP in model 1 is added with TP in model 2 etc)
         [52, 416]]
# calculate mcnemar test
result = mcnemar(table, exact=True)
# summarize the finding
print('statistic=%.3f, p-value=%.3f' % (result.statistic, result.pvalue))
# interpret the p-value
alpha = 0.05
if result.pvalue > alpha:
    print('Same proportions of errors (fail to reject H0)')
else:
    print('Different proportions of errors (reject H0)')
$\endgroup$

1 Answer 1

1
$\begingroup$

Informally democracy.

So how many classifiers did it improve, only 1 than dont add it.

Formally there are a couple of statistical tests.

Cochran's Q test

Is a generalisation of the McNemars test for comparing Machine Learning models.

or read this formal paper where they discuss it.

$\endgroup$
8
  • $\begingroup$ Hi, Thanks for the response. Upvoted. I updated my post with few more info. $\endgroup$
    – The Great
    Commented Jan 11, 2020 at 13:52
  • 1
    $\begingroup$ Hi, I was just reading about mcnemar's test. So basically we pass our confusion matrix as input to this mcnemar's test?.. Which can help compare our two models $\endgroup$
    – The Great
    Commented Jan 11, 2020 at 14:03
  • 1
    $\begingroup$ But sorry, these metrics only convey whether models are different or not. I guess they don't say whether they are superior or not. correct me if I am wrong $\endgroup$
    – The Great
    Commented Jan 12, 2020 at 1:44
  • $\begingroup$ Take xgb before feature 7 and after. Apply mcnamara, you will know if this is stat. sinificant difference or not $\endgroup$
    – Noah Weber
    Commented Jan 12, 2020 at 9:15
  • $\begingroup$ Hi, let's say Xgb with 6 features produces 84% auc and Xgb with 7 features produces 85% AUC. Now if I apply mcnamer's test. I will only know whether they are statistically different or not. So, to know whether that difference is an improvement or not, I have to rely on AUC % right? Because it's from 84% to 85%, it is an improvement and it's statistically different. Am I right in understanding this way? $\endgroup$
    – The Great
    Commented Jan 12, 2020 at 9:25

Your Answer

By clicking “Post Your Answer”, you agree to our terms of service and acknowledge you have read our privacy policy.

Not the answer you're looking for? Browse other questions tagged or ask your own question.