0
$\begingroup$

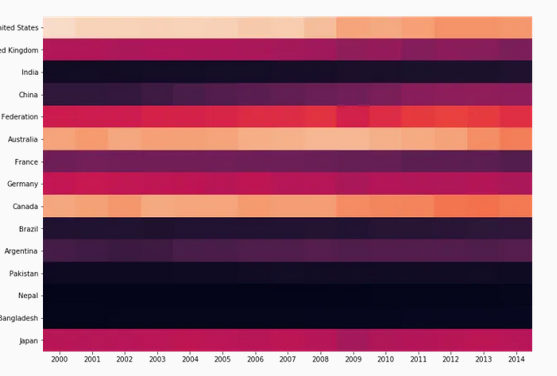
I am trying to save my heat map in png format using the below code, but the labels are getting trimmed when I am saving the heatmap. Please help to keep the labels inside the figure.


    array = confusion_matrix(gts, preds, labels=class_name)
    #print(gts)
    #print(preds)
    df_cm = pd.DataFrame(array, index = class_name, columns = class_name)
    print("Confusion Matrix")
    print(df_cm)
    plt.figure(figsize = (10,7))

    sns_plot = sns.heatmap(df_cm, annot=True, cmap =sns.cm.rocket_r,linecolor='white', linewidths=1)

    results_path = 'results.png'
    #print(results_path)
    plt.savefig(results_path, dpi=400)

enter image description here

$\endgroup$
1
  • 1
    $\begingroup$ Have you tried adding plt.tight_layout() after sns.heatmap? Usually this solves the trimming of labels. $\endgroup$ Commented Mar 27, 2020 at 9:43

1 Answer 1

1
$\begingroup$
results_path = 'results.png'
#print(results_path)
plt.savefig(results_path)
$\endgroup$
1
  • $\begingroup$ When I export the image to a png file. The labels on x,y axes, title of the plot are black in color. So when viewed with photos app in win, the text is not visible. Is there any way to export with white color text? $\endgroup$
    – Mohith7548
    Commented Feb 2, 2021 at 10:19

Your Answer

By clicking “Post Your Answer”, you agree to our terms of service and acknowledge you have read our privacy policy.

Not the answer you're looking for? Browse other questions tagged or ask your own question.