0
$\begingroup$

I am new to Python/Pandas so I'm struggling a bit here.

I have a dataframe with air quality data from 2016 to 2020. I want to calculate the annual rate of change for each measured value to compare them with the value the year before at the same day and month.

These are the first lines of the dataframe.

         Date Country       City Specie count   min   max median variance
0  2020-02-23      CR   San José   pm25    20  13.0  53.0   25.0  1232.00
1  2020-04-04      CR   San José   pm25    23  17.0  57.0   38.0  1302.57
2  2020-04-24      CR   San José   pm25    23  30.0  80.0   59.0  1966.13
3  2020-01-14      CR   San José   pm25    24  13.0  34.0   21.0   379.55
4  2020-02-07      CR   San José   pm25    23  57.0  95.0   72.0   838.97

Does anybody have an idea as to how I can proceed?

$\endgroup$
1

2 Answers 2

0
$\begingroup$

For the answer, I assume below:

  • Data frame has single row for each date in the past years

Set Date as index for the dataframe

df_dateInx = df.set_index('Date')

Now you can get a row for particular date using below code

df_row = df_dateInx.loc['2018-07-15']

Add a new column to dataframe 'ChangePercent' in the last

#df_dateInx.insert(inx_whr_col_to_insert, name_of_col)
df_dateInx.insert(df_row.shape[1], 'ChangePercent', True)

Create a function to calculate the different w.r.t. value the year before at the same day and month. This function would be invoked on each row of data frame

def calChange(row):
   change = 0
   val_prev_yr = df_dateInx.loc[row.Date - 1]['min']
   val_this_row = row['min']
   # do anything with values and return change
   return change

P.S. row.Date - 1 use date/time strptime function to do this

P.S. In case of multiple rows of same date use df_dateInx.loc[row.Date - 1]['min'][0] where [0] means selecting first row among many rows of same date

Invoke above function on each row of data frame

df_dateInx.agg([calChange])

And you would get a dataframe which has values populated in Change column as per your needs

$\endgroup$
4
  • $\begingroup$ thank you very much! except I checked and there are actually multiple rows for the same date, for multiple cities. Does your code still work then? $\endgroup$
    – Ghazal
    Commented May 14, 2020 at 18:45
  • $\begingroup$ edited my answer to reflect this case. If answer suits you, mark it as answer so that others can be benefited too $\endgroup$
    – SimpleGuy
    Commented May 15, 2020 at 2:33
  • $\begingroup$ unfortunately it does not work $\endgroup$
    – Ghazal
    Commented May 22, 2020 at 13:42
  • $\begingroup$ how does the code know which column to add results? $\endgroup$
    – Enes Kuz
    Commented Dec 19, 2022 at 2:51
0
$\begingroup$

Try:

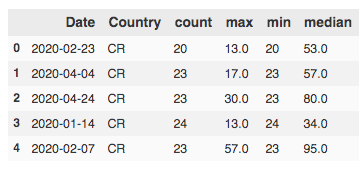
# Toy dataset:
air = pd.DataFrame({"Date":["2020-02-23","2020-04-04","2020-04-24","2020-01-14","2020-02-07"],
"Country":["CR","CR","CR","CR","CR"],
"count":[20,23,23,24,23],
"max":[13.0,17.0,30.0,13.0,57.0 ],
"min":[20,23,23,24,23],
"median":[53.0,57.0,80.0,34.0,95.0]})

Input:

enter image description here

# Index column needs to be a datetime so
air["Date"] = pd.to_datetime(air["Date"])

# Group by year
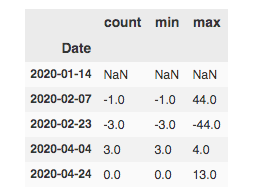
air.set_index("Date").groupby(pd.Grouper(freq = "y"))[["count","min","max"]].diff()

Output:

enter image description here

$\endgroup$

Your Answer

By clicking “Post Your Answer”, you agree to our terms of service and acknowledge you have read our privacy policy.

Not the answer you're looking for? Browse other questions tagged or ask your own question.