6
$\begingroup$

I am having these weird results when playing around with cross-validation that I would greatly appreciate having any comments.

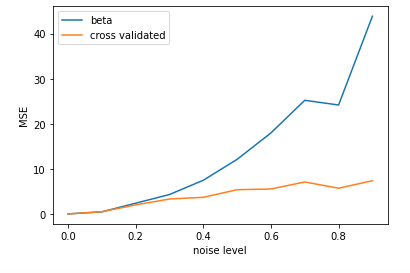
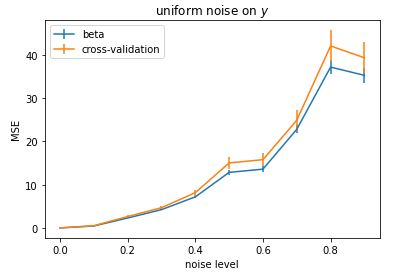
Briefly, I have a lower mean squared error (MSE) when doing regression (least-squares) using cross-validation (CV), than when using the "ground truth weights" that I used to generate the data.

Note, however, that I compute the MSE on noisy data (generated data + noise), so MSE of 0 would not be expected for noise levels above 0.

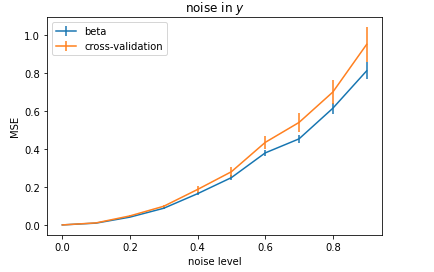
Weirdly, for high noise conditions, I get lower MSE with cross-validated least squares than with the "ground" truth weights used to generate the clean data - to which I then add different levels of noise to the input (X). Instead, if I add gaussian noise to the output (y) the "ground truth weights" perform better.

More details are below.

Simulation of data

I am generating beta from a gaussian and X from a uniform distribution. I then compute the to-be-regressed y as y = beta * X. python 3 code:

def generate_data(noise_frac):
  X = np.random.rand(ntrials,nneurons)
  X = np.random.normal(size=(ntrials,nneurons))
  
  beta = np.random.randn(nneurons)
  y = X @ beta

  # not very important how I generated noise here
  noise_x = np.random.multivariate_normal(mean=zeros(nneurons), cov=diag(np.random.rand(nneurons)), size=ntrials)

                            
  X_noise = X + noise_x*noise_frac

  return X_noise, y, beta


As you can see I also add noise to X.

Regression

I then project this noised data X_noise for different values of noise onto beta:

y_hat = (X_noise) @ beta

And compute the MSE:

mse = mean((y_hat - y)**2)

As expected, MSE increases with noise (blue line in the figure).

MSE for CV and ground truth beta weights

However, I get lower MSE if I use cross-validated least-squares! This is now an orange line in the figure.

To do CV, I split X_noise in random 100 train and test sets. In broad terms, This is how I do CV in python:

beta_lsq = pinv(X_train) @ y_train
y_hat_lsq = (X_test) @ beta_lsq
mse = mean((y_hat_lsq - y_test)**2)

On the other hand, if I add noise to y, instead of X, then everything makes sense:

enter image description here

P.S.: This is a crosspost from stack overflow

$\endgroup$
7
  • $\begingroup$ Can you specify nneurons and ntrials to make this reproducible? $\endgroup$ Commented Jul 6, 2020 at 11:40
  • 1
    $\begingroup$ Sorry, here's the link to a notebook that reproduces this: colab.research.google.com/drive/… $\endgroup$ Commented Jul 6, 2020 at 12:35
  • $\begingroup$ I only asked for those two parameters; anyway, I see they are ntrials = 1000 nneurons = 100 $\endgroup$ Commented Jul 6, 2020 at 12:58
  • $\begingroup$ the mentioned cross-post: stackoverflow.com/q/62744439/10495893 $\endgroup$
    – Ben Reiniger
    Commented Jul 7, 2020 at 20:14
  • $\begingroup$ I can't actually reproduce your second graph; I still get a noticeably larger mse for the ground truth model compared to the fitted model. $\endgroup$
    – Ben Reiniger
    Commented Jul 8, 2020 at 1:41

2 Answers 2

2
$\begingroup$

The main problem in your test is that your X has the same scale as your noise level (0-1), as a result, adding a noise changes your data distribution significantly.

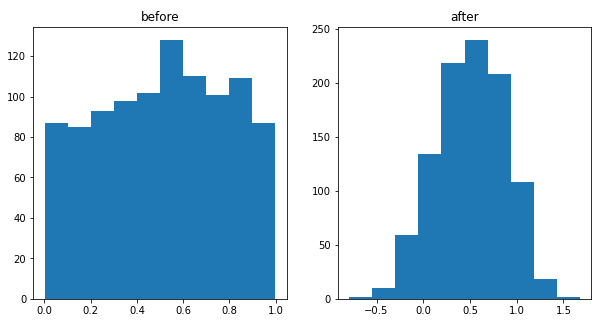
This is your data distribution before and after adding noise.

enter image description here

It is like the noise is 50-200% more than your initial data. That's why you get a better result with CV than the "ground truth weights". Because the new fitted model by CV is tuned for an X with a new distribution.

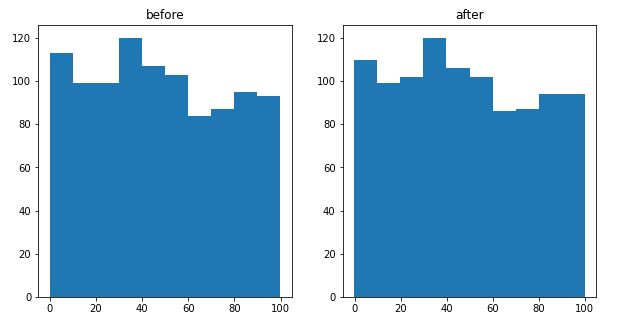
However, if you increase your X values scale, for example, 100*np.random.rand(ntrials,nneurons), your data have the same distribution before and after adding noise.

enter image description here

Now if you run your code, you will get what you expected.

result

$\endgroup$
1
$\begingroup$

It seems that the reason why you're getting the better result has nothing to do with cross-validation, but rather with weight adjustment happening during calculation of cross-validation result in train_decode function. To check this, I have used the following simulation,

results = {"beta": [], "folds": []}
noises =  np.arange(0,1,0.1)

for noise_frac in noises:
  print(noise_frac) 
  acc_folds = []
  acc_bests = []
  for _ in  range(1000):
    X, y, beta = generate_data(noise_frac)
    beta_prime = train_decode(X,y)
    acc_folds.append(test_decoder(beta_prime,X,y))
    acc_bests.append(test_decoder(beta,X,y))

  results["beta"].append(acc_bests)
  results["folds"].append(acc_folds)

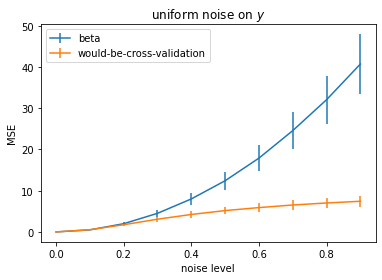
as well as before, the errors follow the same trend, and have roughly the same values,

errors-graph

here, the beta-result is calculated as following:

$y=\beta\times X$

$y^\prime=\beta\times (X+noise)$

$MSE = mean((y^\prime-y)^2)$

while, the would-be-cross-validation-result is calculated using adjusted $\beta$:

$y=\beta\times X$

$\beta^\prime=(X+noise)^{-1}\times y$

$y^\prime=\beta^\prime\times (X+noise)$

$MSE = mean((y^\prime-y)^2)$

To conclude all, I can say the simulation shows that adjusted weights(beta) bring the error in target values closer to irreducible error.

$\endgroup$

Your Answer

By clicking “Post Your Answer”, you agree to our terms of service and acknowledge you have read our privacy policy.

Not the answer you're looking for? Browse other questions tagged or ask your own question.