1
$\begingroup$

I have the following problem. From a technical model we have a function $f(n,p)$ approximating its runtime. The function $f$ which maps

$$ f: \mathbb{N} \times \mathbb{P} \to \mathbb{R}_{+} $$ where $\mathbb{P} = \{1,\ldots,50\} \subset\mathbb{N}$. $n$ defines the amount of input and $p$ is a parameter of the process, which has a continuous influence on the runtime. We are interested in the value of $p$ such that $f(n,p)$ for a given $n$. At the run the experiment some $n$, like 500, 1000, 5000, and for all possible values of $p$ and then select the optimal $p$ by hand. Like for everything smaller than 750 use the optimal $p$ of the test run with $n=500$ and so on. Typically for a fixed $n$ the runtime over $p$ has the following style but with noise added: Demo Picture For increasing $n$ the bottom moves to the right and due to noise the bottom is not flat. So in the example the optimal $p$ is somewhere between $20$ and $30$.
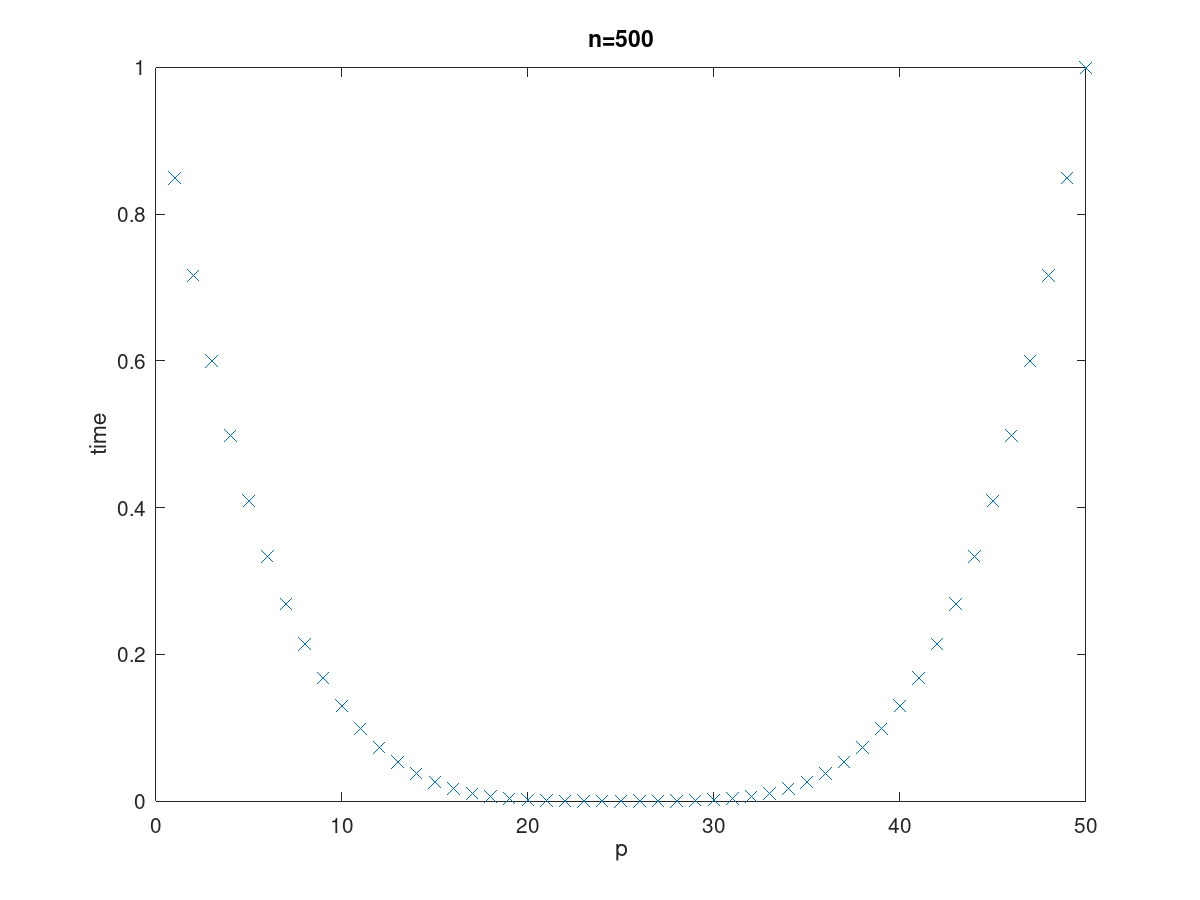
We are now searching for a function $g$:

$$ g: \mathbb{N} \to \mathbb{P} $$ which is defined by $$ g(n) = \operatorname{argmin}\limits_{p\in\mathbb{P}} f(n,p) $$

Since sampling $f$ for fixed $n$ is not a problem and I already have a large set of samples I think this will be a good problem to start with for looking into the machine learning area for myself.

My basic question is where to start? Search for machine learning tutorial I mostly end up with the image recognition examples and did see any good connections between those and my problem. Any suggestions about stuff to read for this problem? Any idea which software to use? And finally how to extract $g$ such that we can provide this function to the users or implement somewhere? At the moment I know that $g$ is non-decreasing for increasing $n$.

Edit The sampling results can also look like this enter image description here
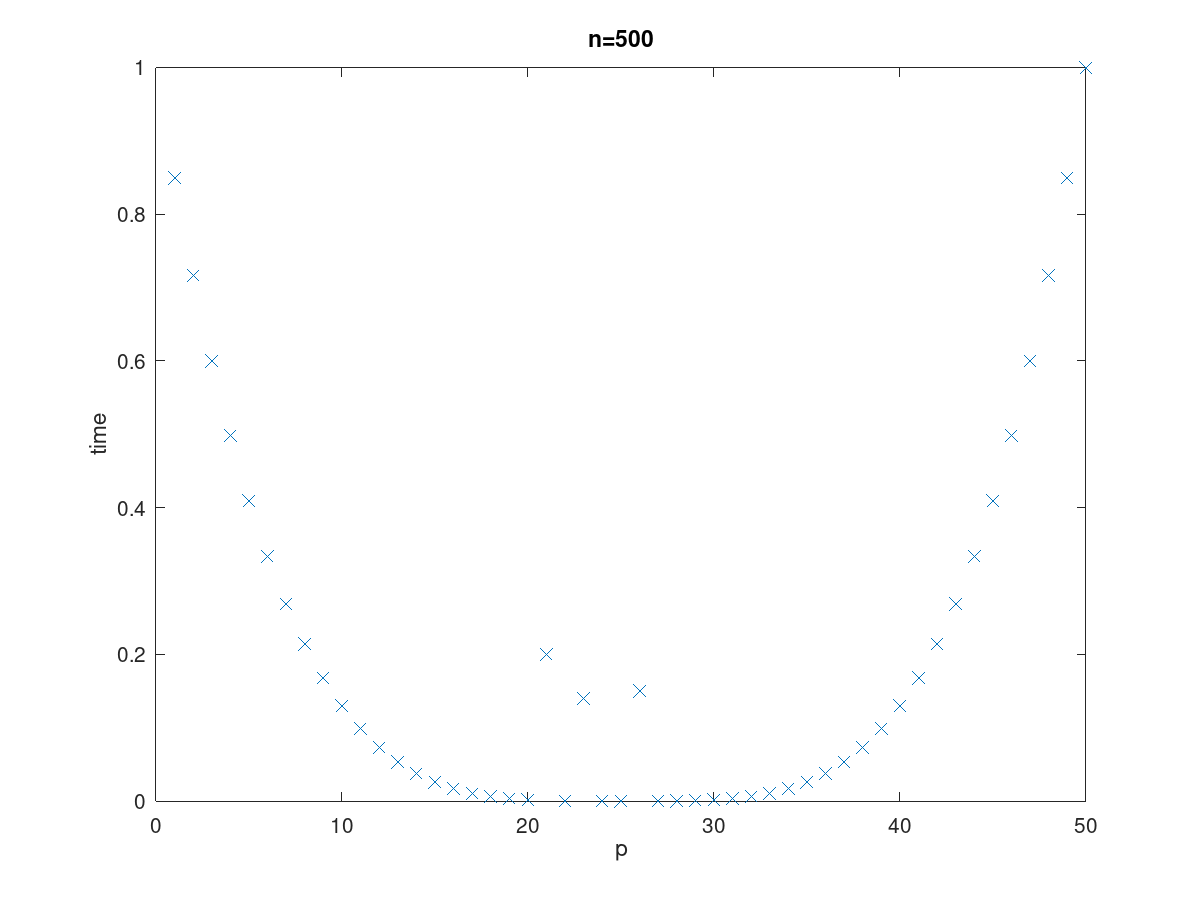
Thereby the spikes in the "mininum" point area are no noise. They are caused by technical internals of the regarded process. So while processing the data and removing the noise these points need to kept. And they make finding $g$ so hard because in one sampling run the minimal $p$ lies left, in the middle or right of them. For this reason I though this would be a good point to use machine learning to get some insights.

$\endgroup$
2
  • 1
    $\begingroup$ Not sure this is a ML problem. I would approximate the function with splines to remove noise then take the minimum of the spline approximated function. From the graph I am not sure that the difference between choosing p=20 or p=30 matter that much. $\endgroup$ Commented Jan 4, 2021 at 15:01
  • $\begingroup$ I tried some kind of approximation to solve this issue but it was not satisfying. For this reason I want to try something new, what in the end gives me some new input how p need to be chosen. $\endgroup$ Commented Jan 4, 2021 at 16:45

2 Answers 2

0
$\begingroup$

If I understand correctly, the goal will be for the model to be provided with a value $n$ and predict the optimal $p$ which minimizes $f(n,p)$.

From this point of view, it looks like a simple regression problem. You could probably train a regression model: for every point in your training set, the predictor is $n$, the response variable is the $p$ value which minimizes $f(n,p)$ for this $n$. Note that all the points which don't correspond to the minimum are irrelevant in this context.

I'd suggest you start by plotting this function from your data (not the one with a fixed $n$, the one which maps $n$ to the optimal value of $p$). It would be useful to know what it looks like, in particular to choose an appropriate regression method.

[edit] About dealing with noise.

The standard statistical way to deal with noise is to do nothing at all :)

How much data do you have? Because if you have enough data, statistically the noise should balance itself out. For instance if you have 100 such graphs for a fixed $n$, the mean optimal $p$ should be close enough to the true optimal $p$. Even if for a few values of $n$ the data doesn't contain the optimal value of $p$, across sufficiently many values of $n$ this noise is unlikely to be significant. What matters is for the regression model to correctly represent the general trend, and not to capture the small variations due to noise.

I would start with a graph made of one boxplot for each value of $n$ and varying $n$, where the set of values represented in a boxplot are all the mnimum $p$ in the data for this value of $n$.

[edit 2] Another interesting visualization: you can represent your full data as a heatmap with $n$/$p$ on the X/Y axis and the colour based on the value of $f(n,p$)$.

$\endgroup$
2
  • $\begingroup$ One problem of our sampling, due to external influences, is that if we run the whole sampling for a fix $n$ several times, we get different minima. All in a range but different. In my not so optimal example plot above, we can get 20 for the first sampling run, 25 for the second, and so on. If there are spikes in the plot in this area, they are no noise, they are caused by technical internals. I updated the post with a second plot. $\endgroup$ Commented Jan 5, 2021 at 7:45
  • $\begingroup$ @M.K.akaGrisu see edit: assuming you have enough data, the noise should not be a problem. $\endgroup$
    – Erwan
    Commented Jan 5, 2021 at 10:43
0
$\begingroup$

Since you state that anomalous values follow a distinct pattern, one option is remove any values greater than a change threshold. The change threshold could be set by hand or learned. In other words, make a rule based on the first derivative of the realized data points.

Here is an example in Python:

time_all = [.8, .7, .6, .5, .4, .3, .2, .1, 0, .2, 0, 
            .2,  0, .1, .2, .3, .4, .5, .6, .7, .8]
change_threshold = .15        

time_valid = [time_all[0]]
for t0, t1 in zip(time_all, time_all[1:]):
    if (t0 - t1) < change_threshold:
        time_valid.append(t1)
$\endgroup$

Your Answer

By clicking “Post Your Answer”, you agree to our terms of service and acknowledge you have read our privacy policy.

Not the answer you're looking for? Browse other questions tagged or ask your own question.