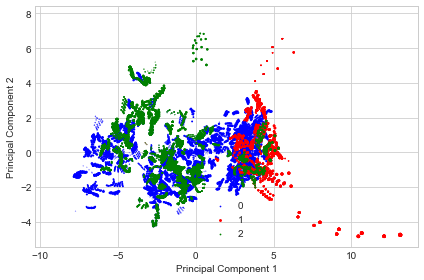
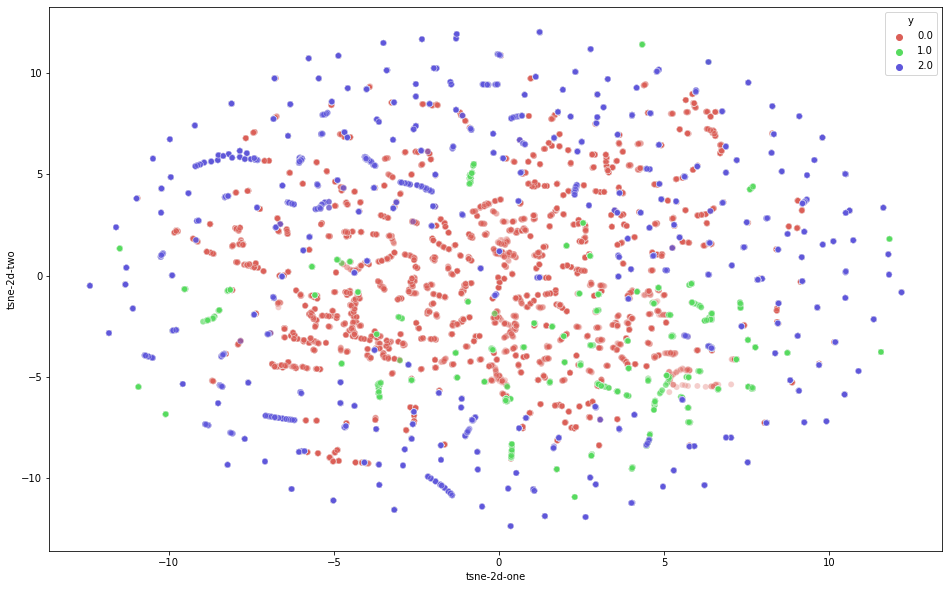
I'm working on a classification (3 classes) of unbalanced weather data having 22 features. Even after applying PCA and t-SNE the data is overlapping. The best classification score achieved so far is using the tree-based method. What can be the reason for such PCA plot and what techniques I can implement to get more than 80% accuracy? 

$\begingroup$
$\endgroup$
1
-
1$\begingroup$ It could be that your features are not terribly predictive of the outcome. Worth reading… $\endgroup$– DaveCommented Oct 26, 2021 at 0:19
Add a comment
|
1 Answer
$\begingroup$
$\endgroup$
I would recommend to use UMAP. It is a superior algorithm to both of them:
- YOUTUBE: UMAP explained | The best dimensionality reduction?
- Publication: UMAP: Uniform Manifold Approximation and Projection for Dimension Reduction
- Guide: How to Program UMAP from Scratch
- CODE: GitHub - NikolayOskolkov/HowUMAPWorks: Here I explain the math behind UMAP and show how to program it from scratch in Python
- Official Library
