2
$\begingroup$

I have a retail dataset. I am trying to identify groups of products which are generally bought within a span of few days or on the same days (consider multiple store visits). For example - If someone is doing a painting DIY project at their house, they'd buy paints, paint rollers, painters tape, putty, putty knife etc, before and during the project.

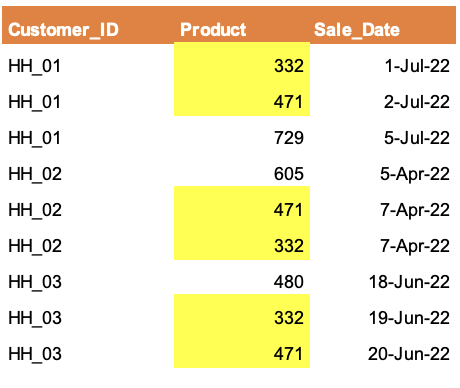
My dataset looks like below:

enter image description here

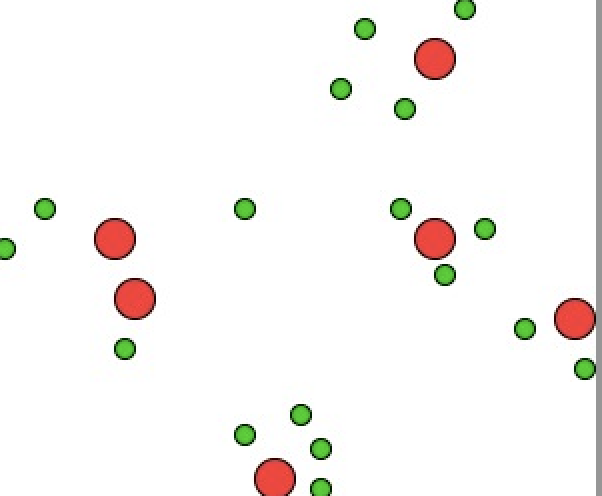
Above, you could see that products #332 & #471 were bought within few days by all the 3 customers. So these products are kind of associated. This suggests that customers who are doing a project X, they tend to buy #332 & #471 together. At the end of the day, I want to divide the product universe in few product clusters, where each cluster could be identified as some kind of project, something like below.

enter image description here

The way I am thinking to perform this is by:

  1. Performing Apriori. Get lifts for {A => B}
  2. Use lifts to create a m x m matrix, each data value will be a lift, m = number of products (in my case ~200)
  3. Standardize, and perform PCA to reduce dimension (to 5 or 6)
  4. Perform k-means on m x n dataframe. This would give me products who have similar lifts towards the same products.

I am not sure if there are other techniques. Please let me know if anyone has experience working on similar use cases or have any suggestions. (PS: I have done clustering of customers using RFM, but RFM can't be applied here since it'll be a grouping of products and not customers)

$\endgroup$

1 Answer 1

1
$\begingroup$

Why not use dimensional reduction algorithms?

UMAP or t-SNE are quite simple to implement, they are non-linear (contrary to PCA) and they make meaningful clusters. Then, you can apply a KMeans.

Here is an example with UMAP:

import pandas as pd
import numpy as np
import umap
import sklearn.cluster as cluster

mydata = ... #Dataframe with numeric features
mapper = umap.UMAP().fit(mydata)

umap.plot.points(mapper)

#After checking how many labels you have:
kmeans_labels = cluster.KMeans(n_clusters=10).fit_predict(mydata)

#you can also display a PCA diagnostic
umap.plot.diagnostic(mapper, diagnostic_type='pca')

Sources:

https://umap-learn.readthedocs.io/en/latest/plotting.html

https://plotly.com/python/t-sne-and-umap-projections/

https://umap-learn.readthedocs.io/en/latest/clustering.html

$\endgroup$
3
  • $\begingroup$ Does it answer your question? If not, please let me know. $\endgroup$ Commented Aug 23, 2022 at 14:09
  • $\begingroup$ Thanks Martin, I could not get the time yet to test this and check the results. But I will comeback once I have this done. $\endgroup$
    – Grammilo
    Commented Aug 23, 2022 at 15:56
  • $\begingroup$ Very well, no rush :) $\endgroup$ Commented Aug 23, 2022 at 18:01

Your Answer

By clicking “Post Your Answer”, you agree to our terms of service and acknowledge you have read our privacy policy.

Not the answer you're looking for? Browse other questions tagged or ask your own question.