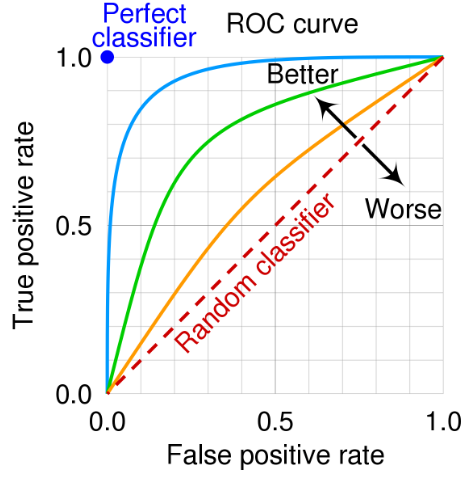
I have a problem. I am currently looking at a classifier and I would like to examine this using an ROC curve as a metric. However, questions have arisen to which I can not find an answer.
A ROC curve describes the following
ROC curves are frequently used to show in a graphical way the connection/trade-off between clinical sensitivity and specificity for every possible cut-off for a test or a combination of tests. In addition the area under the ROC curve gives an idea about the benefit of using the test(s) in question.
- Why does an ROC curve become a curve in the first place?
- Why does TP (True Positive) and FP (False Positive) rate change?
- And why does the ratio vary?

