0
$\begingroup$

I have some geospatial data in lat/lon form accurate to 6th decimal place.

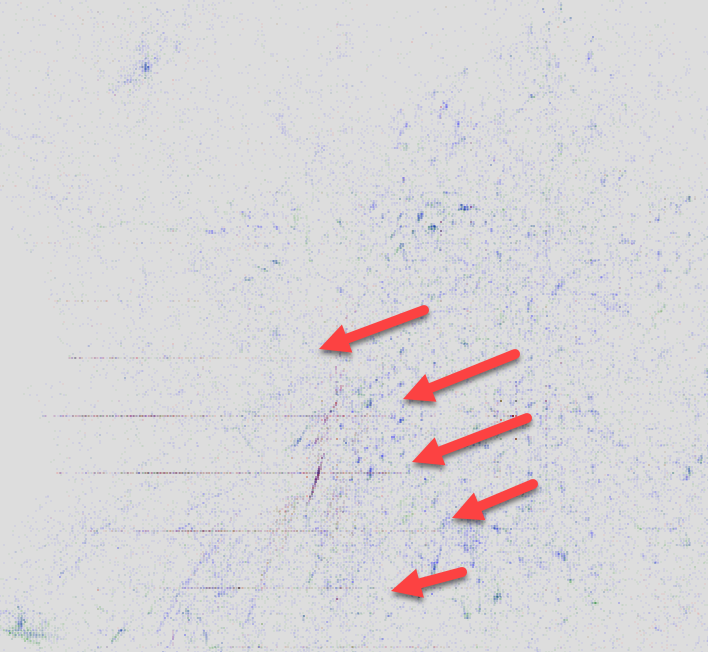
As shown in the picture below, there are some over-represented lines of points at specific latitudes which appear in the sample. In that example they are at fixed latitudes (which happen to be evenly spaced, but that is not relevant to the question).

In other cases though, we have observed similar over-represented lines at an arbitrary slant ie. not a fixed latitude.

Is there an algorithm to detect

a) lines of overpresentation in sample lat/lon data at fixed lattitude

or even better

b) a general algoritm to detect lines of overrepresentation at arbitrary slants in geospatial data

?

enter image description here

$\endgroup$

1 Answer 1

3
$\begingroup$

You might take a look into Hough Transform. It is usually applied on images but it can be easily adapted for 2 dimensional data. There are various packages, but a straight-forward custom implementation would be enough for your purposes. The original Hough transform was used to detect straight line, but suffered some improvements and with some efforts can be employed to detect also other shapes.

$\endgroup$
1
  • $\begingroup$ Good suggestion thanks! $\endgroup$ Commented Nov 8, 2022 at 23:30

Your Answer

By clicking “Post Your Answer”, you agree to our terms of service and acknowledge you have read our privacy policy.

Not the answer you're looking for? Browse other questions tagged or ask your own question.