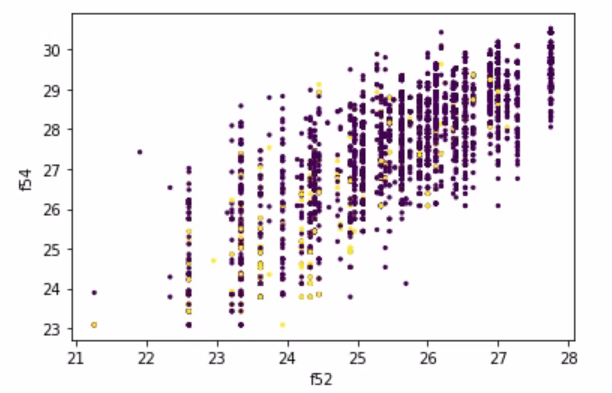
I am trying to solve classification task. Could you suggest me, if these two features are independent? the plot looks strange 
-
$\begingroup$ The answers you got so far only adress the overall shape of the scatter plot. On close inspection, you color-coded the points to reflect a label, and you actually plotted the square roots of the original features. If there's more context to your question, that you wish the answerers to address, please edit your question to make your intentions clearer. $\endgroup$– KishKashCommented Nov 10, 2022 at 7:06
-
1$\begingroup$ This question shows little or no effort. A better question would be to at least investigate various correlation or association tests. Choose a statistical test and carry out these tests. This way a debate could be formed on the 'proper' evaluation method. Without the data, we are all guessing. 'Without data, you're just another person with an opinion.' $\endgroup$– mccurcioCommented Nov 10, 2022 at 14:06
2 Answers
Those features appear to be not independent, knowing the values of one feature gives information about the values of another feature. One way to quantify that relationship is through rank correlation. Rank correlation is appropriate because one of the features is measured on a discrete scale.
The features have a correlation that is evident upon visual inspection. As either feature increase or decreases, the other does the same. This screams out correlation. Testing this formally could be done using a linear regression of either feature on the other, but the graph is extremely convincing.
If you think the plot looks weird because of the vertical stripes, that is likely due to your feature $52$ being measured at discrete values, likely integers. This is fine, though you might be interested in introducing a “jitter” for plotting purposes.

