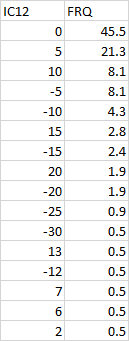
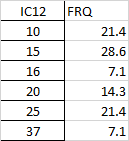
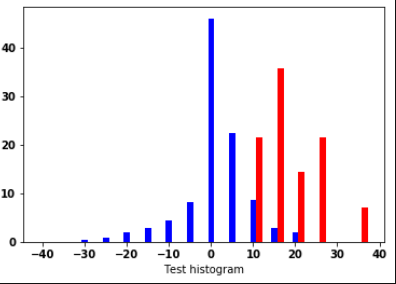
Hello folks, I am trying to plot a grouped bar plot of two variables with varying lengths, which means the x and y length of both the variables are different. The format of the data is given below: This is for NRI.
This is for RI.
I want these two datasets to be grouped together. When I try to plot it both the datasets are overlapping each other. If anyone can help me in this regard it will be much appreciated.
Here is the code I used:
import numpy as np
from mpl_toolkits.basemap import Basemap
import matplotlib.pyplot as plt
import matplotlib.path as mpath
from PIL import *
import os
import sys
import csv
from matplotlib import rc, rcParams
import pandas as pd
from matplotlib.ticker import (MultipleLocator, FormatStrFormatter,
                               AutoMinorLocator)
#df = pd.read_csv('E:/v.csv')
df = pd.read_excel('IC12_freq.xlsx',sheet_name='NRI')
df_1 = pd.read_excel('IC12_freq.xlsx',sheet_name='RI')


x = df.IC12.values
x1 = df_1.IC12.values
y = df.FRQ.values
y1 = df_1.FRQ.values
fig, ax = plt.subplots(figsize=(10,10))
ax.bar( x+1.3,y,color = 'w', width = 1.3,hatch='***',edgecolor='k',label='NRI',align='center')
#ax.twinx()
ax.bar( x1,y1,color = 'w', width = 1.3,hatch='/////',edgecolor='k',label='RI',align='center')
#ax.plot(x, y,'ro',color = 'k')
#ax.plot(x1, y1,'ro',color = 'r')
ax.xaxis.set_major_locator(MultipleLocator(10))
ax.xaxis.set_major_formatter(FormatStrFormatter('%d'))
ax.xaxis.set_minor_locator(MultipleLocator(5))
ax.xaxis.set_minor_formatter(FormatStrFormatter('%d'))
# For the minor ticks, use no labels; default NullFormatter.
ax.yaxis.set_major_locator(MultipleLocator(10))
ax.yaxis.set_major_formatter(FormatStrFormatter('%d'))
ax.yaxis.set_minor_locator(MultipleLocator(5))
ax.yaxis.set_minor_formatter(FormatStrFormatter('%d'))

plt.rcParams["font.weight"] = "bold"
axis_font = {'fontname':'Arial', 'size':'14'}
tick_font = {'fontname':'Arial', 'size':'5'}

ax.tick_params(which='both', width=2)
ax.tick_params(which='major', length=7)
ax.tick_params(which='minor', length=7)
plt.xlabel('IC12(kt)', fontweight='bold',**axis_font)
#plt.xticklabel(**tick_font)
plt.ylabel('Frequency(%)', fontweight='bold',**axis_font)
ax.set_facecolor("#f1f1f1")
ax.spines['top'].set_linewidth(1.5)
ax.spines['right'].set_linewidth(1.5)
ax.spines['bottom'].set_linewidth(1.5)
ax.spines['left'].set_linewidth(1.5)
leg = ax.legend()

#plt.grid(True)
#plt.style.use('ggplot')
##plt.xlabel("x axis", **axis_font)
#plt.ylabel("y axis", **axis_font)
#plt.bar(y,x)
#plt.savefig('IC12_frq.tif', bbox_inches='tight', dpi=300)
plt.show


