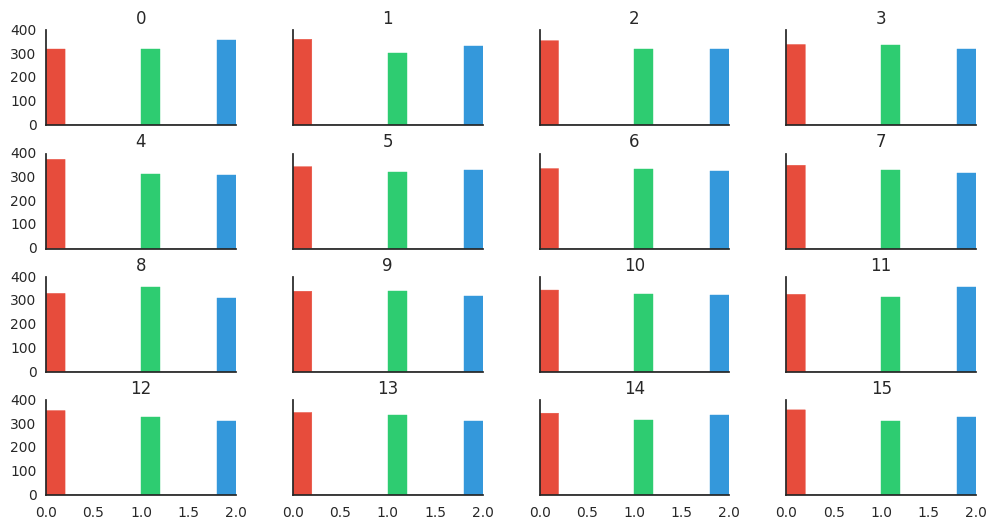
There isn't any built-in function to do this directly in pandas, but by getting the array collection of AxesSubplot, iterating on them to retrieve the matplotlib patches you can achieve the desired result.
Here's some dummy data to play with:
import pandas as pd
import numpy as np
df = pd.DataFrame(np.random.randint(low=0, high=3, size=(1000,16)))
Now, here's the magic:
import matplotlib.pyplot as plt

# Plot and retrieve the axes
axes = df.hist(figsize=(12,6), sharex=True, sharey=True)

# Define a different color for the first three bars
colors = ["#e74c3c", "#2ecc71", "#3498db"]

for i, ax in enumerate(axes.reshape(-1)):
    # Define a counter to ensure that if we have more than three bars with a value,
    # we don't try to access out-of-range element in colors
    k = 0

    # Optional: remove grid, and top and right spines
    ax.grid(False)
    ax.spines['top'].set_visible(False)
    ax.spines['right'].set_visible(False)

    for rect in ax.patches:
        # If there's a value in the rect and we have defined a color
        if rect.get_height() > 0 and k < len(colors):
            # Set the color
            rect.set_color(colors[k])
            # Increment the counter
            k += 1

plt.show()


