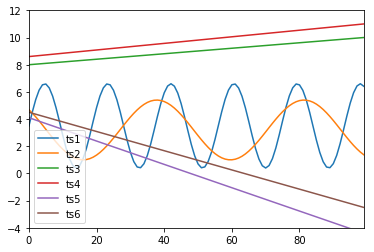
I believe that I implemented MDTW in python here but I don't know if I did it correctly. The results seem intuitive. Can someone look at this code and tell me if you see anything wrong?
A lot of the papers I read on the subject kinda go over my head, but this just takes the mse of all column vectors in matrix s1 and s2 at each time point inside a given window w instead of single dimensional dynamic time warping which just takes the mse error of each value between two vectors and finds the smallest one.
I use panda's Panel, which is essentially a 3D version of a DataFrame.
Also, after I have this, I want to do clustering with some multidimensional time series. Thoughts on which clustering algorithm to run? Kmeans? Hierarchical? I'll start by building a dendrogram at least.
import numpy as np
import pandas as pd
import matplotlib.pyplot as plt

def MDTWDistance(s1, s2, window=10, num_columns=1):
    DTW={}

    w = max(window, abs(len(s1)-len(s2)))

    for i in range(-1,len(s1)):
        for j in range(-1,len(s2)):
            DTW[(i, j)] = float('inf')
    DTW[(-1, -1)] = 0

    for i in range(len(s1)):
        for j in range(max(0, i-w), min(len(s2), i+w)):
            #print "Finding Distance of", s1.loc[i], s2.loc[j]
            dist= mdist(s1.loc[i], s2.loc[j], num_columns)
            #print "Dist", dist
            #print i, j, dist
            DTW[(i, j)] = dist + min(DTW[(i-1, j)],DTW[(i, j-1)], DTW[(i-1, j-1)])

    return np.sqrt(DTW[len(s1)-1, len(s2)-1])

def mdist(a, b, num_col):
    dist = 0
    for col in range(num_col):
        #print "Finding Distance of", a[col], b[col]
        dist = dist + (a[col]-b[col])**2
    return dist

x=np.linspace(0,50,100)
ts1=pd.Series(3.1*np.sin(x/1.5)+3.5)
ts2=pd.Series(2.2*np.sin(x/3.5+2.4)+3.2)
ts3=pd.Series(0.04*x+8.0)
ts4=pd.Series(0.048*x+8.6)
ts5=pd.Series(-0.17*x+4.1)
ts6=pd.Series(-0.14*x+4.5)

ts1.plot()
ts2.plot()
ts3.plot()
ts4.plot()
ts5.plot()
ts6.plot()

plt.ylim(-4,12)
plt.legend(['ts1','ts2','ts3','ts4','ts5','ts6'])
plt.show()

timeSeries = pd.Panel({0:pd.DataFrame(np.transpose([ts1, ts2])),
                 1:pd.DataFrame(np.transpose([ts3, ts4])),
                   2:pd.DataFrame(np.transpose([ts5, ts6]))
                  })

print "0 and 1:",MDTWDistance(timeSeries[0], timeSeries[1],window=10, num_columns=2)
print "0 and 2:",MDTWDistance(timeSeries[0], timeSeries[2],window=10, num_columns=2)
print "1 and 2:",MDTWDistance(timeSeries[1], timeSeries[2],window=10, num_columns=2)
The output is as follow:
0 and 1: 89.354619036
0 and 2: 58.8268328591
1 and 2: 133.434513377
With the graph:
EDIT: I found the distance using an MDTW package in R with the following code:
import rpy2.robjects.numpy2ri
from rpy2.robjects.packages import importr
rpy2.robjects.numpy2ri.activate()

# Set up our R namespaces
R = rpy2.robjects.r
DTW = importr('dtw')

# Generate our data
idx = np.linspace(0, 2*np.pi, 100)
template = np.cos(idx)
query = np.sin(idx) + np.array(R.runif(100))/10

for i,j in ([0,1], [0,2], [1,2]):
    print "From", i, "to", j, R.dtw(np.transpose(np.array(timeSeries[i])), np.transpose(np.array(timeSeries[j])), keep=True).rx('distance')[0][0]
which output:
From 0 to 1 186.623310713
From 0 to 2 119.769089068
From 1 to 2 272.849560995
So these numbers are about double the distances I have... so I'm not far off, but there's something wrong with what I'm doing. Halp.

