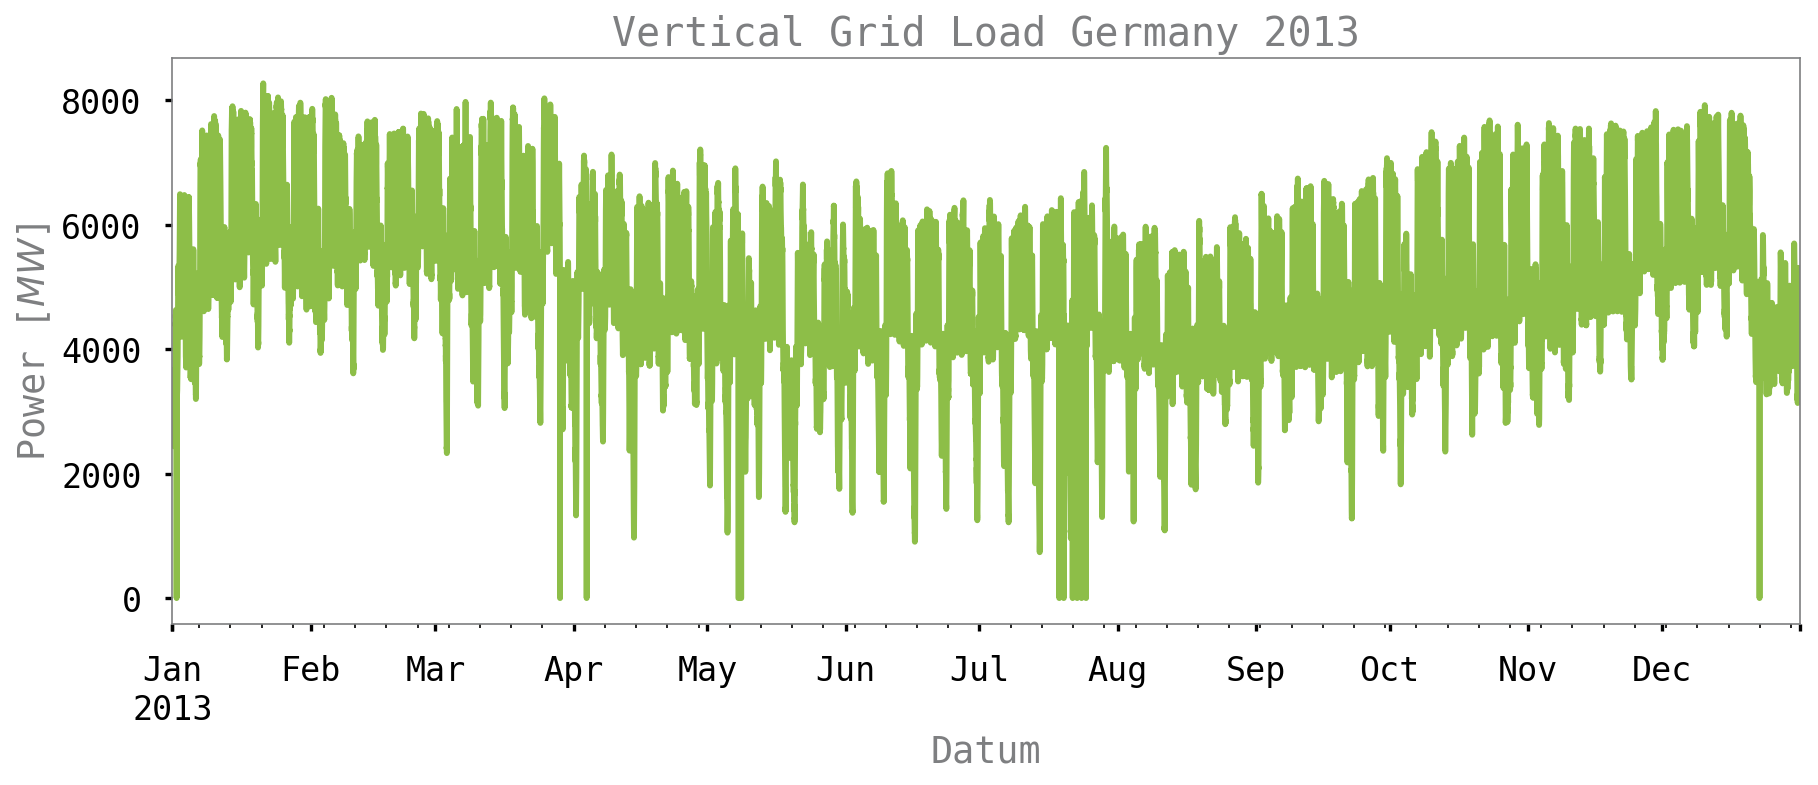
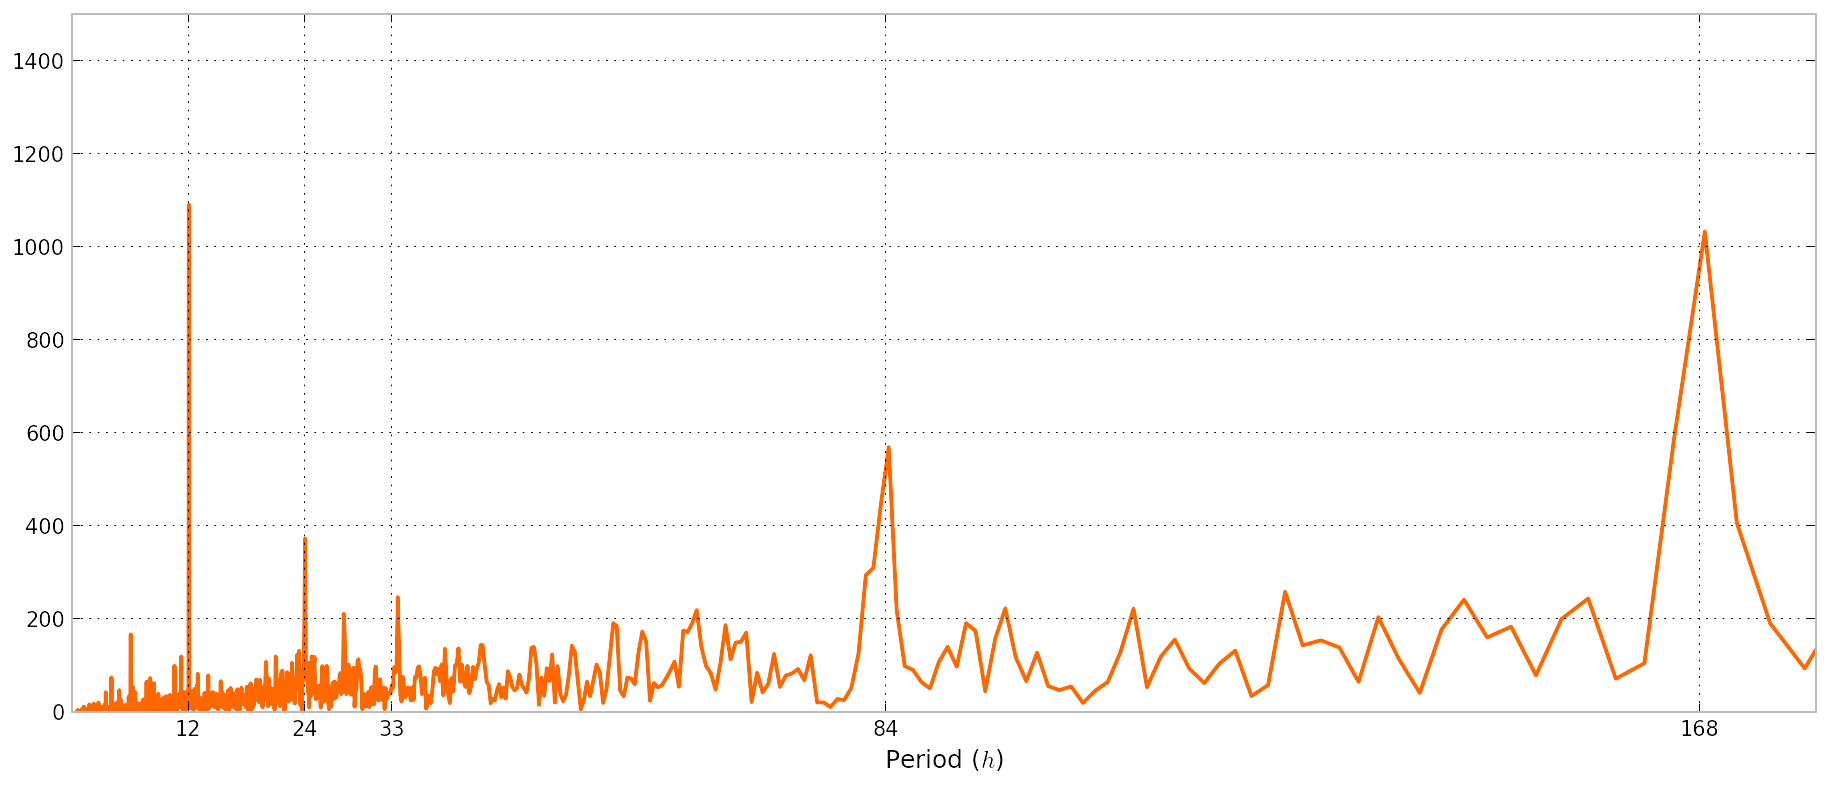
As a part of a statistical analysis engine, I need to figure out a way to identify the presence or absence of trends and seasonality patterns in a given set of time series data. While most answers and tutorials in the Internet outlines methods to predict or forecast time series data using machine learning models, my objective is simply to identify the presence any such pattern.
Example: daily sales data through a year
This data set could show upward trends with monthly seasonality or no actual trend with yearly seasonality.
If I am not to manually inspect the scatter plot of the distribution, in what ways can I determine the presence of those patterns?
I have looked at the following approaches so far:
Using moving average or exponential smoothing to smooth the time series curve and then check if the resulting line can be approximated to a linear curve, which is supposed to provide an upwards or downward trend if any.
Using auto correlation to check for seasonality, which I am yet to confirm if it's a possible solution or not (any ideas?)


