1
$\begingroup$

I have a multivariable regression problem which basically forms a plane in 3D space. There may be other independent variables at play, but if I can approach the problem with 2 independent variables then I should be able to scale to include the rest.

Broadly, it's a resource problem. I have a required resource (z), which depends on time (x) and number of registered users (y). Registered users is a function of time, but I need the time component because the resource requirement is different at different times of the day. I want to be able to predict the resource requirement at a given time of day if our users continue to registered at a known rate.

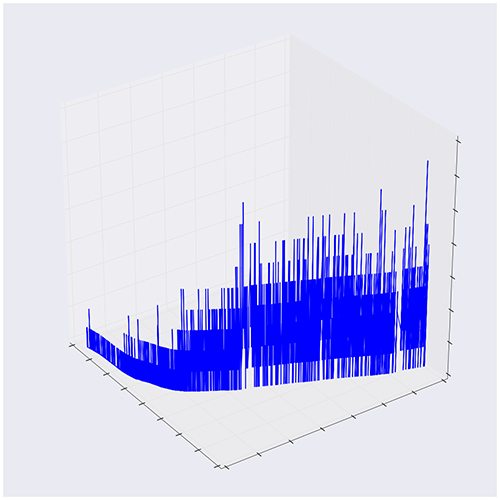
Here is a chart of the data:

Required resource as a function of date and number of registered users.

This is obviously not a linear regression problem, so how do I approach this?

$\endgroup$
5
  • $\begingroup$ In the figure mentioned above have all the possible times been accounted for? What I mean to ask is in your prediction are you going to interpolate to extrapolate? $\endgroup$
    – user-116
    Commented Sep 8, 2017 at 14:03
  • $\begingroup$ @RahulAedula All historic times are accounted for (they're bucketed into 10 minute slots). The chart is missing data as I've sampled for brevity. I do not think I'll have to interpolate to extrapolate. $\endgroup$
    – Josh
    Commented Sep 8, 2017 at 14:13
  • 1
    $\begingroup$ Read about interaction terms and en.wikipedia.org/wiki/Polynomial_regression Why do some stems seemingly have gaps at the bottom? Is z an interval rather than a scalar? $\endgroup$
    – Emre
    Commented Sep 8, 2017 at 16:42
  • $\begingroup$ @Josh Since it's interpolation you should try polynomial regression. That would be your safest bet. Because you need to account for the various irregular variations. It would be nice if you had a statistical model which could give a better insight into your variables, but since that might not be the case you should start with polynomial regression. $\endgroup$
    – user-116
    Commented Sep 9, 2017 at 5:28
  • $\begingroup$ @Emre the gaps at the bottom are because there are times where there is a zero resource requirement. There's a lot of data on this chart, which makes it looks like it's a solid plane, but really it's a line with very fine resolution. $\endgroup$
    – Josh
    Commented Sep 12, 2017 at 9:40

2 Answers 2

2
$\begingroup$

If you want to predict, you need an underlying model of the behavior. Then you can perform least-squares fitting to determine the model parameters. Linear regression just assumes that you have a linear relationship and predicts from that relationship - there's nothing magic about it, except that the model is simple and often effective. Polynomial regression gives bad behavior when extrapolating, so I wouldn't advise that.

Building a model function is usually a trial-and-error process (unless you have some prior knowledge about your system, which I guess you don't). I'd suggest looking at the locus of (x, y) points where z is maximized. It looks like they have an exponential decay relationship. A model like y = exp(-x/x0) might fit the data rather closely. Once you've determined the value of x0 from the data, you can rebuild a model for z.

$\endgroup$
2
  • $\begingroup$ This is useful, but I don't think it get's to the heart of the problem. Wouldn't a model like y = exp(-x/x0) smooth over the interesting variations at different times of the day? Even at the far right of the chart, there are times where there is a zero resource requirement. An exponential relationship wouldn't ever predict zero, even though we want it to. $\endgroup$
    – Josh
    Commented Sep 12, 2017 at 9:39
  • $\begingroup$ I wasn't saying that y = exp(-x/x0) is necessarily the right model function for your problem, just that it looked like a reasonable first guess from your data (which is not available to me). I'm not aware of any general procedure to find the best model function. $\endgroup$ Commented Sep 12, 2017 at 21:24
1
$\begingroup$

Reframe the problem as time series. Predict "z" over time, given some level of "y".

$\endgroup$

Your Answer

By clicking “Post Your Answer”, you agree to our terms of service and acknowledge you have read our privacy policy.

Not the answer you're looking for? Browse other questions tagged or ask your own question.