1
$\begingroup$

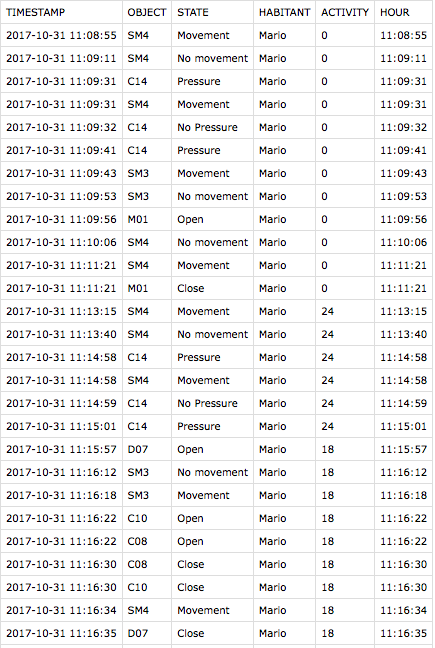
I have a bunch of streams coming from a set of 28 binary sensors around a SmartHome like this: enter image description here

Where:

  • OBJECT: indicates the name of a binary sensor
  • STATE: is obviously the state of the sensor at that precise instant (you can think of it like Movement/Pressure/Open=1 and NoMovement/NoPressure/Close=0)
  • ACTIVITY: is the Label I would like to predict and indicates the activity the Human was doing
  • TIMESTAMP/HOUR: you know what they mean...

The activities to be recognised are 24 and are a bit complex. For example: making breakfast, making lunch, making dinner, having breakfast, having lunch, having dinner, going to the toilet, teeth brushing, dressing, watch TV, and so on...

Can you suggest a technique to use this dataset for AR?

$\endgroup$
4
  • $\begingroup$ Have you tried a Random Forest? $\endgroup$ Commented Sep 28, 2018 at 6:33
  • $\begingroup$ But how? Can you point to some explanation on how to apply random forst to stream? $\endgroup$ Commented Sep 28, 2018 at 15:34
  • $\begingroup$ Is this dataset available anywhere? Interesting problem! $\endgroup$
    – Jon Nordby
    Commented Apr 6, 2019 at 12:42
  • $\begingroup$ Looks like the dataset is mamilab.esi.uclm.es/ucami2018/UCAmICup.html $\endgroup$
    – Jon Nordby
    Commented Apr 7, 2019 at 14:46

1 Answer 1

1
$\begingroup$

First you need to find a way to formulate this as a classification problem, where you have pairs of features (from your sensor data) and labels (the activity).

Bag of features

A simple way is to cut up the observations into a series of time-windows, where inside each window you ignore the temporal parts of your sensor data (a "bag of features" representation). Keep track of the current (or most common) state of each sensor, and count the number of sensor transitions that happened (ex: C08open->close: 2 times).

To select the appropriate length of time-window you should do some Exploratory Data Analysis to find typical activity durations.

Both during training and prediction, the time-windows should be computed with overlap. Say that each window is 5 minutes long. Then the next window contains the 4 last minutes, plus 1 new minute of data. Overlap is usually in a range of 50-90%.

Note that some activities are quite time-dependent. Like make dinner or make lunch. So you should include also a feature time_of_day which is seconds/minutes since midnight.

Temporal models

Some transitions between activities are probably much more common that others, and this is a source of information that can be used. Example: making dinner -> having dinner probably way more likely than making breakfast -> making dinner. A Hidden Markov Model (HMM) would be the standard way to model that. It can give you the most probable sequence of activities for a whole day.

There are some ways to use CNNs and RNNs on these kinds of datasets, but unless the dataset is huge I would probably not try that.
$\endgroup$
2

Your Answer

By clicking “Post Your Answer”, you agree to our terms of service and acknowledge you have read our privacy policy.

Not the answer you're looking for? Browse other questions tagged or ask your own question.