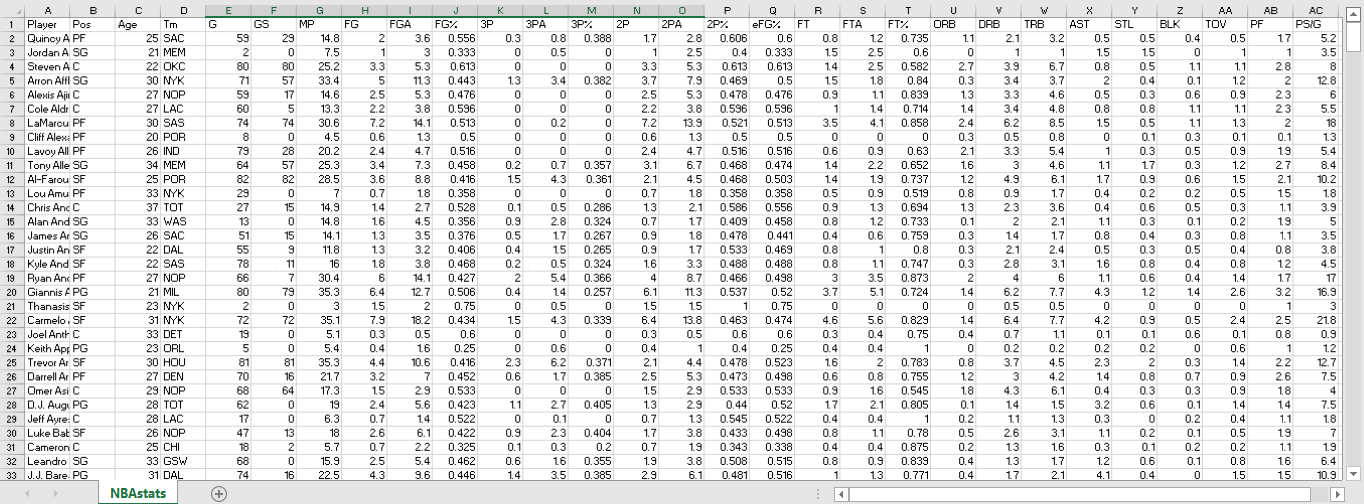
I have to implement the k means algorithm from scratch using python on this data set that has 29 columns and 476 rows. With all these different data points I am confused on how I can calculate the distance between the centroids and the data in order to make sure the data is in the right cluster. I know I have to use the euclidean distance, but I am not sure how I can use it with this data set. All the examples I've seen online usually deal with something that is only 2 dimensional. I need someone to explain to me what kind of approach I should take for this. This is the dataset:

1 Answer
- First of all, you need to convert your categorical columns to numerical if you like to take them into account (e.g. column $T_m$).
- You need to normalize your features as there is variance in scale (e.g. column $G$ vs $BLK$)
- You probably need to reduce dimensionality as k-means MIGHT get stuck in Curse of Dimensionality.
The rest is fine. Euclidean distance generalizes for any number of dimensions. $$\sqrt{(x_{1} - x_{2})^2 + (y_{1} - y_{2})^2 + (z_{1} - z_{2})^2 + ...}$$
So, when you calculate your k-means, you will get $k$ points each of them in $d$ dimensions ($d$ is the number of columns). Then for each data point you calculate the distance above for data point and the center i.e.
$$\sqrt{(x_{data} - x_{center})^2 + (y_{data} - y_{center})^2 + (z_{data} - z_{center})^2 + ...}$$
Python does it for you easily.
