1
$\begingroup$

Considering the data is received from a streaming source each second.How to distinguish if both the line graphs 'look' same/different in real time, statically, like the picture given below enter image description here
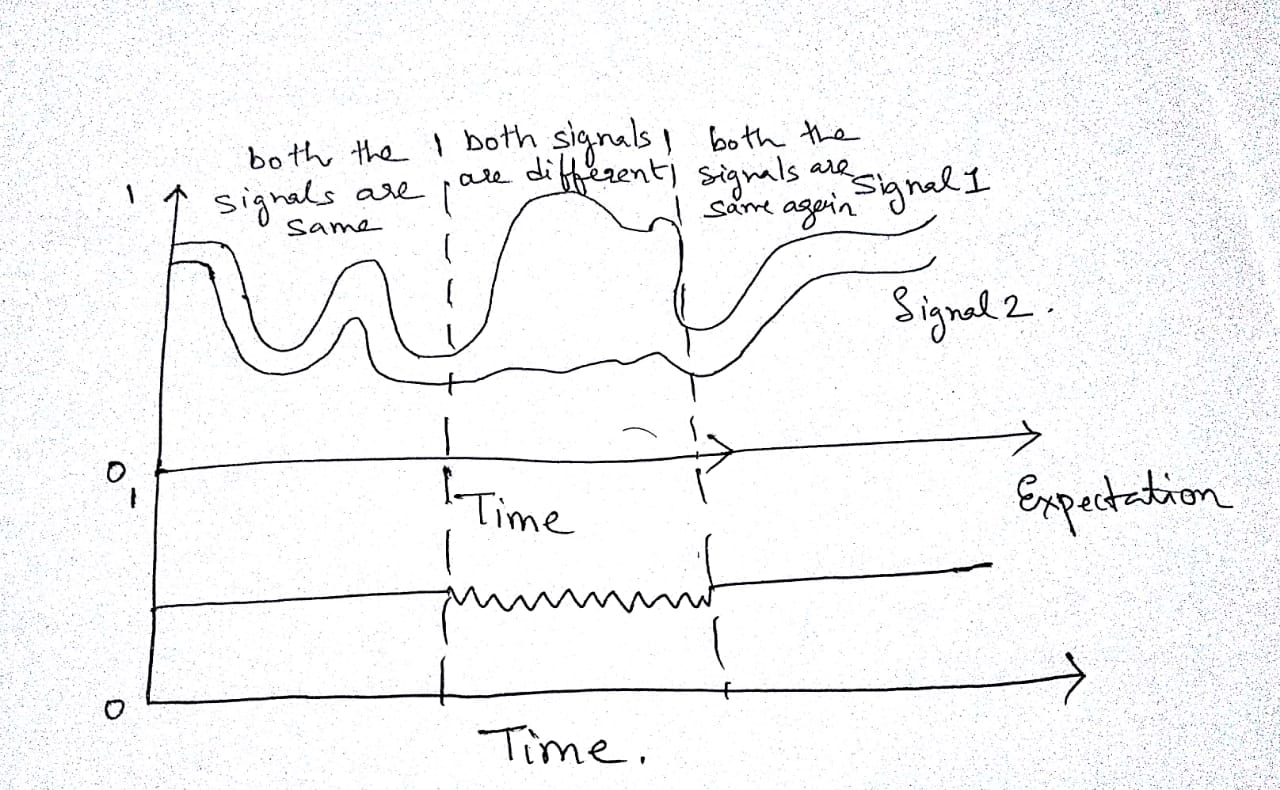

Edit:
1.Not sure if there is something as real-time periodic correlation mechanism then cross-correlation would perhaps be an ideal solution ?
2. Comparing slope of the two Line is the last option I would go with. 3. If statistically there is no way to solve this then I would look at machine learning to solve this

$\endgroup$

3 Answers 3

1
$\begingroup$

Maybe it is a huge oversimplification, but you can try: What if you do just arithmetic difference between the two signals (or divide one signal to another one) and look at the result?

I would expect that you will have spikes where signals become very different and you can make a threshold to find where they are on time.

$\endgroup$
0
0
$\begingroup$

I am unsure on how to do this statistically apart from using the slope. However, there are some interesting ways to think about time series in a given time period to find similarity. You could do as follows:

  1. Use the characteristics of the signal in a given time window and construct an n dimensional vector.
  2. You could use similarity measures or distance measures like cosine, manhattan etc to evaluate the similarity between them.
$\endgroup$
2
  • $\begingroup$ even with slope methods ,considering both the signals donot rise or fall by equal slopes , how to detect if they are similar? $\endgroup$
    – Rai Bose
    Commented Nov 15, 2018 at 18:47
  • $\begingroup$ I am not quite sure, maybe finding the average of the slope and comparing helps. Here is how you could find the average of the slope : searchink.atlassian.net/wiki/spaces/PROJ/pages/282329252/… I still think finding a vector representation and using other metrics/measures will help you evaluate this better. $\endgroup$
    – Nischal Hp
    Commented Nov 15, 2018 at 18:58
-1
$\begingroup$

be series1 = S and series2 = T

It would come from:

Tn - Sn-1 = Sn - Tn-1, then:

Tn - Tn-1
-------------- = 1
Sn - Sn-1

In this way, favorable cases will give 1 and unfavorable cases will show noise.

$\endgroup$
2
  • $\begingroup$ can you elaborate this? $\endgroup$
    – Rai Bose
    Commented Apr 16, 2019 at 8:56
  • $\begingroup$ Of course, the only way to know that the graphs behave the same is by comparing with the previous data. $\endgroup$ Commented Apr 16, 2019 at 20:57

Your Answer

By clicking “Post Your Answer”, you agree to our terms of service and acknowledge you have read our privacy policy.

Not the answer you're looking for? Browse other questions tagged or ask your own question.