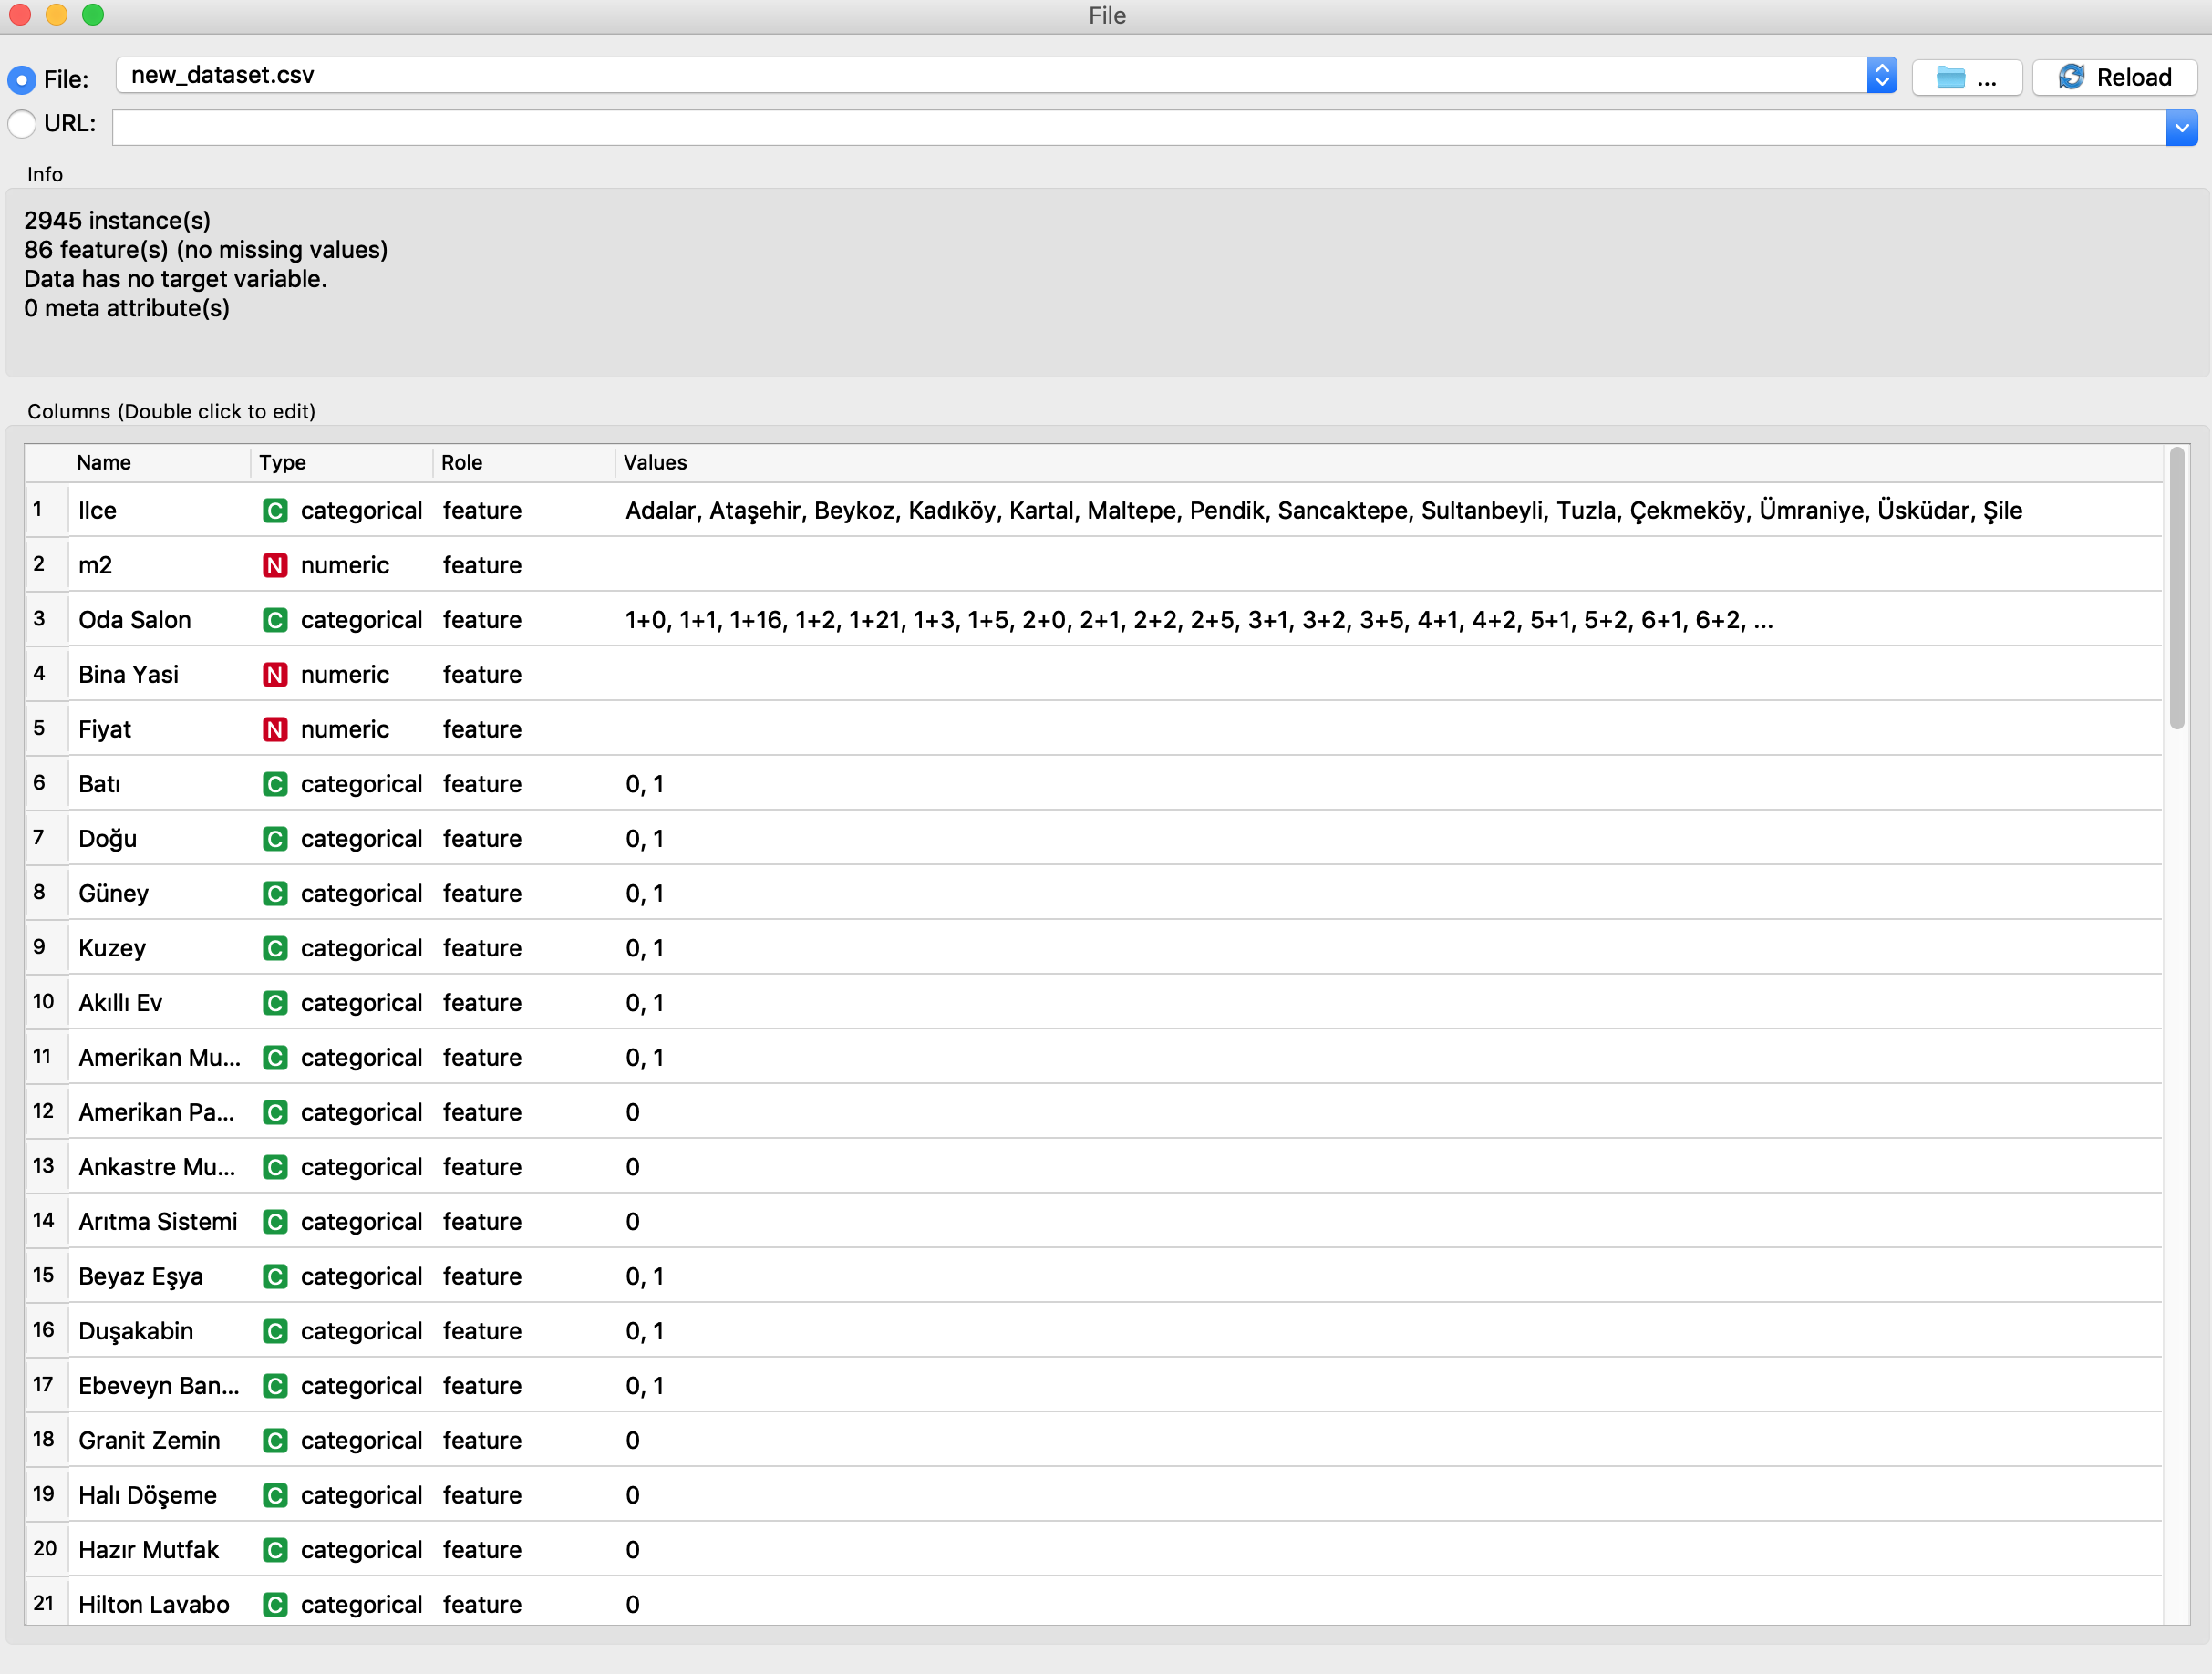
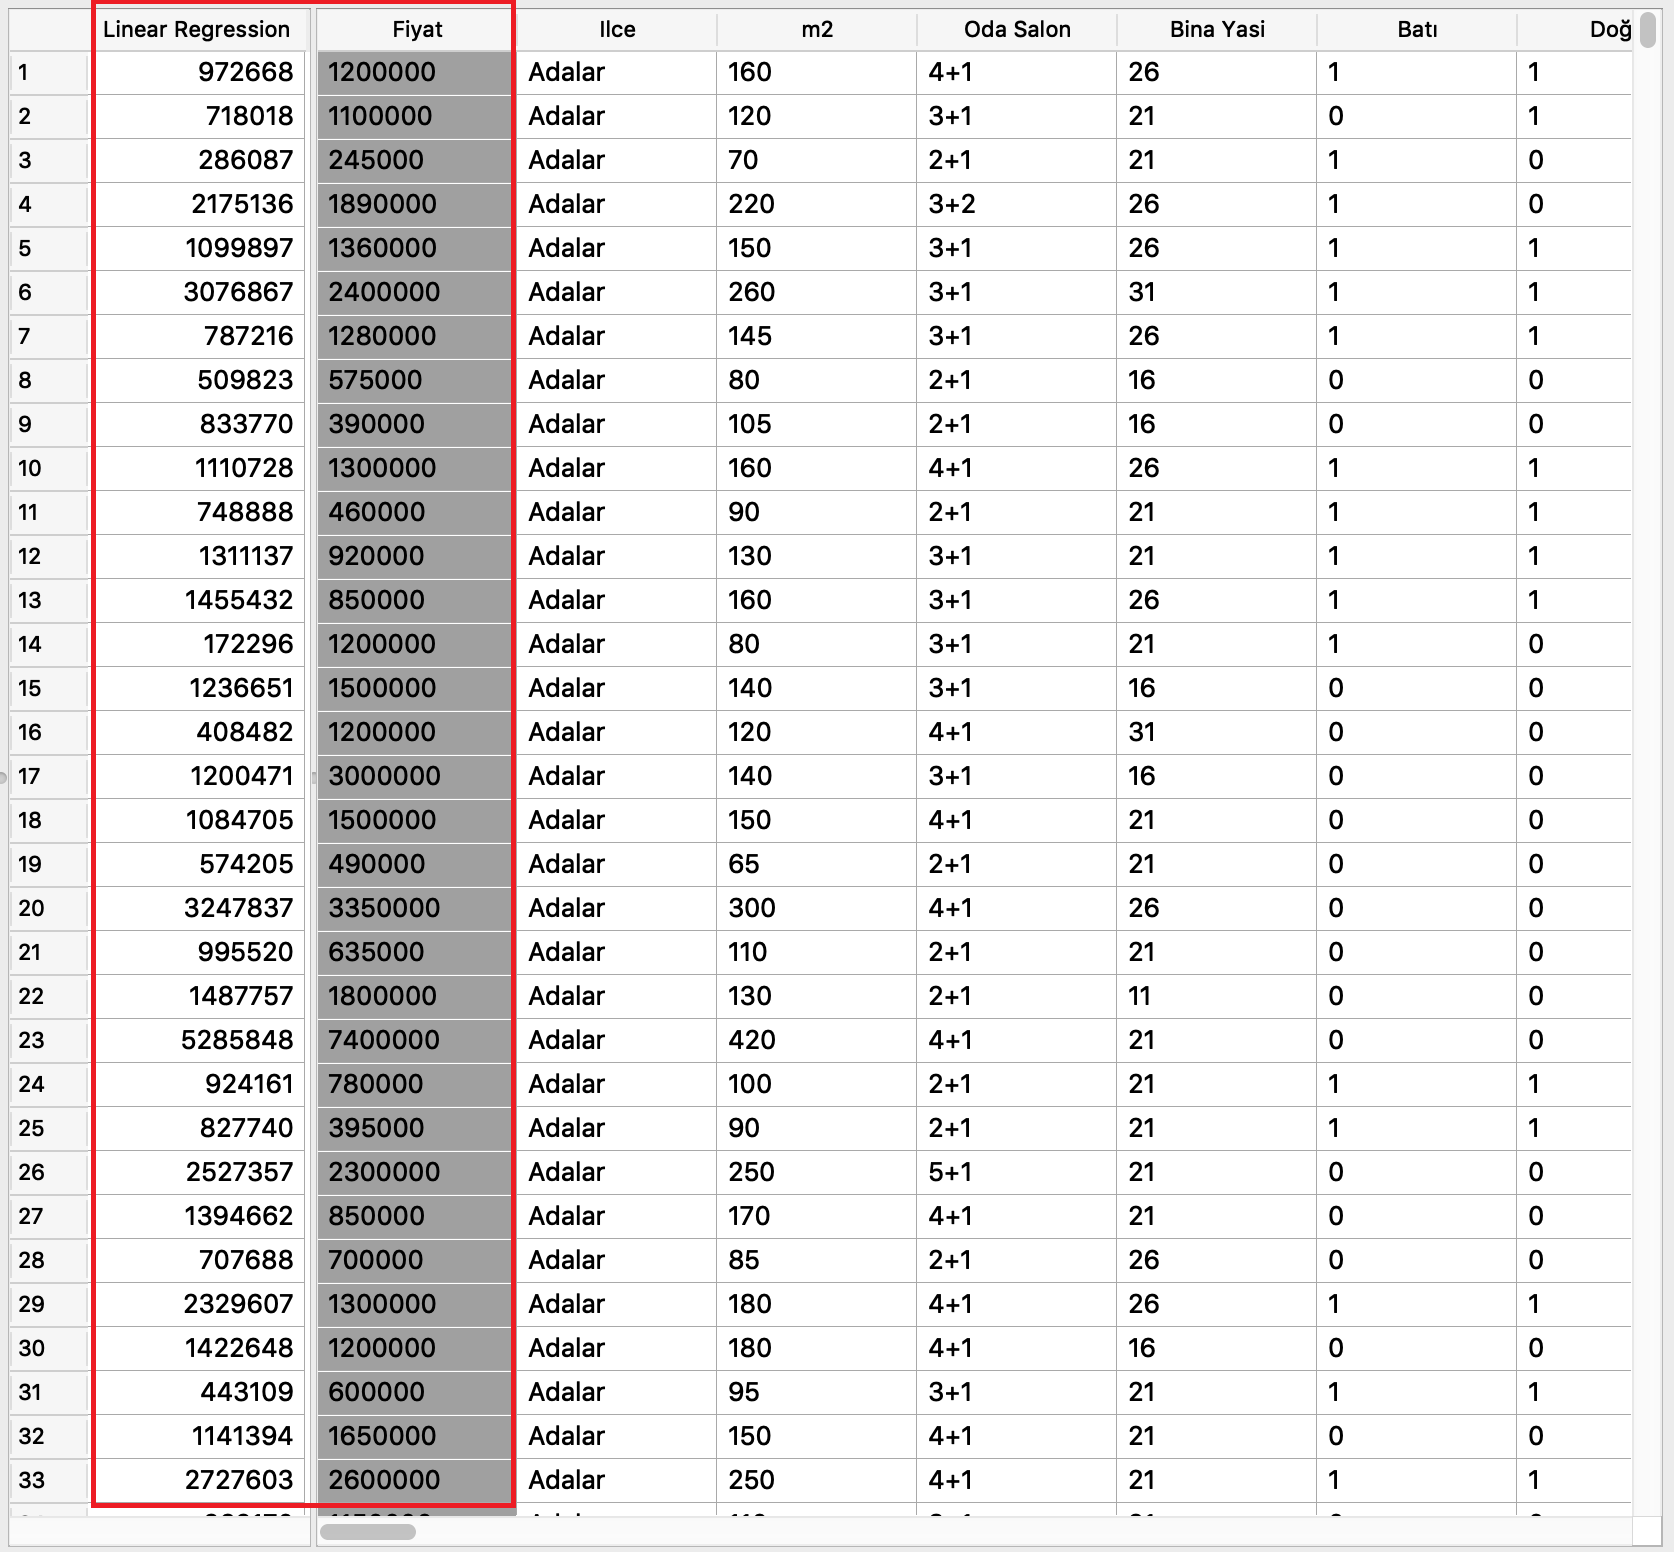
I'm trying to predict a house price using linear regression method. I gather the real data from a real estate website. I have some features and two numerical value in which the price is the target variable to be guessed. I have about 3000 data in which first column is provinces, area field of the house as meter square, following how many salon + rooms, and the other features as 0 or 1. What I try to obtain is a formula(coefficients). However, the Orange Toolkit which I use shows far strange guessing. Is there any wrong step or omitted step(s)? Can be the guesses improved? By the way, via the Box link the dataset can be downloaded.
$\begingroup$
$\endgroup$
Add a comment
|
1 Answer
$\begingroup$
$\endgroup$
5
Some things to note:
- Your data contrains indicators with no variation, remove them (not sure if they are automatically dropped in your application)
- Add polinomials for "m2" to improve the fit
- Try using the log of "m2"
Your results are simply the consequence of a bad fit. Look at the R^2 and the mean absolute error. I think there is little room to improve the fit any further in an OLS setting.
The best I could do quickly gives a mae of 258434 / R2=0.58. So you fail by some 258434 units on average in your prediction.
Call:
lm(formula = Fiyat ~ poly(m2, 10, raw = T) + ., data = dat)

Residuals:
     Min       1Q   Median       3Q      Max
-6864176  -190364      301   131575 20452070

Coefficients: (1 not defined because of singularities)
                          Estimate Std. Error t value Pr(>|t|)
(Intercept)              2.470e+07  5.729e+06   4.311 1.68e-05 ***
poly(m2, 10, raw = T)1  -1.848e+06  3.749e+05  -4.929 8.76e-07 ***
poly(m2, 10, raw = T)2   5.701e+04  1.015e+04   5.618 2.11e-08 ***
poly(m2, 10, raw = T)3  -9.411e+02  1.513e+02  -6.222 5.63e-10 ***
poly(m2, 10, raw = T)4   9.326e+00  1.380e+00   6.757 1.70e-11 ***
poly(m2, 10, raw = T)5  -5.850e-02  8.090e-03  -7.231 6.12e-13 ***
poly(m2, 10, raw = T)6   2.371e-04  3.100e-05   7.648 2.77e-14 ***
poly(m2, 10, raw = T)7  -6.173e-07  7.706e-08  -8.011 1.65e-15 ***
poly(m2, 10, raw = T)8   9.943e-10  1.195e-10   8.322  < 2e-16 ***
poly(m2, 10, raw = T)9  -8.994e-13  1.048e-13  -8.584  < 2e-16 ***
poly(m2, 10, raw = T)10  3.488e-16  3.964e-17   8.799  < 2e-16 ***
IlceAtasehir            -1.855e+05  8.994e+04  -2.062 0.039275 *
IlceBeykoz               4.925e+04  8.370e+04   0.588 0.556325
IlceÇekmeköy            -3.554e+05  9.068e+04  -3.919 9.10e-05 ***
IlceKadiköy              2.803e+05  8.855e+04   3.166 0.001564 **
IlceKartal              -3.790e+05  8.705e+04  -4.354 1.39e-05 ***
IlceMaltepe             -3.065e+05  8.814e+04  -3.478 0.000514 ***
IlcePendik              -3.721e+05  9.133e+04  -4.074 4.75e-05 ***
IlceSancaktepe          -4.431e+05  9.077e+04  -4.882 1.11e-06 ***
IlceSile                -4.746e+05  8.422e+04  -5.636 1.91e-08 ***
IlceSultanbeyli         -4.081e+05  9.168e+04  -4.451 8.87e-06 ***
IlceTuzla               -3.956e+05  8.975e+04  -4.408 1.08e-05 ***
IlceÜmraniye            -2.777e+05  9.185e+04  -3.023 0.002524 **
IlceÜsküdar              6.886e+04  8.704e+04   0.791 0.428931
m2                              NA         NA      NA       NA
`Oda Salon`1+1          -1.786e+05  2.131e+05  -0.838 0.401936
`Oda Salon`1+16          1.651e+05  7.199e+05   0.229 0.818646
`Oda Salon`1+2          -6.592e+05  5.347e+05  -1.233 0.217670
`Oda Salon`1+21         -2.802e+05  7.203e+05  -0.389 0.697349
`Oda Salon`1+3          -2.865e+05  4.514e+05  -0.635 0.525770
`Oda Salon`1+5          -3.472e+05  3.536e+05  -0.982 0.326228
`Oda Salon`2+0          -1.754e+05  4.071e+05  -0.431 0.666687
`Oda Salon`2+1          -2.357e+05  2.191e+05  -1.076 0.282167
`Oda Salon`2+2          -2.658e+05  3.176e+05  -0.837 0.402742
`Oda Salon`2+5          -3.400e+05  3.767e+05  -0.903 0.366802
`Oda Salon`3+1          -2.205e+05  2.217e+05  -0.995 0.320057
`Oda Salon`3+2          -2.383e+05  2.362e+05  -1.009 0.313198
`Oda Salon`3+5          -4.054e+05  3.422e+05  -1.184 0.236316
`Oda Salon`4+1          -3.964e+05  2.275e+05  -1.743 0.081513 .
`Oda Salon`4+2          -8.005e+05  2.383e+05  -3.360 0.000790 ***
`Oda Salon`5+1          -2.213e+05  2.468e+05  -0.896 0.370068
`Oda Salon`5+2          -8.853e+05  2.731e+05  -3.242 0.001200 **
`Oda Salon`6+1          -1.228e+06  3.856e+05  -3.186 0.001461 **
`Oda Salon`6+2          -1.075e+06  3.246e+05  -3.311 0.000941 ***
`Oda Salon`6+3          -3.735e+06  7.681e+05  -4.862 1.23e-06 ***
`Oda Salon`7+2          -6.971e+07  9.975e+06  -6.989 3.44e-12 ***
`Oda Salon`7+3          -1.982e+06  7.255e+05  -2.732 0.006338 **
Bati                     4.756e+04  2.866e+04   1.659 0.097145 .
Dogu                    -3.334e+04  2.762e+04  -1.207 0.227453
Güney                   -4.931e+04  2.943e+04  -1.675 0.094008 .
Kuzey                   -1.060e+05  3.521e+04  -3.011 0.002623 **
`Akilli Ev`              1.898e+05  5.759e+04   3.296 0.000993 ***
`Amerikan Mutfak`       -5.887e+04  4.319e+04  -1.363 0.173001
`Beyaz Esya`             2.681e+05  4.909e+04   5.462 5.11e-08 ***
Dusakabin               -2.155e+04  3.629e+04  -0.594 0.552626
`Ebeveyn Banyosu`        8.674e+04  3.529e+04   2.458 0.014025 *
Kiler                   -1.156e+05  4.324e+04  -2.673 0.007552 **
Küvet                    7.295e+04  4.786e+04   1.524 0.127554
Mobilya                 -1.255e+05  5.194e+04  -2.416 0.015741 *
`Parke Zemin`            8.113e+03  2.762e+04   0.294 0.769021
`Seramik Zemin`          1.968e+04  2.886e+04   0.682 0.495326
Vestiyer                -2.499e+04  3.240e+04  -0.771 0.440650
Deniz                    3.070e+05  3.833e+04   8.011 1.64e-15 ***
Doga                     1.926e+04  2.834e+04   0.679 0.496936
Sehir                    3.760e+04  3.175e+04   1.184 0.236481
ADSL                    -1.644e+04  3.094e+04  -0.531 0.595204
`Fiber Internet`        -2.553e+04  3.498e+04  -0.730 0.465493
`Kablo TV`              -1.419e+04  3.141e+04  -0.452 0.651406
Uydu                     2.616e+04  3.133e+04   0.835 0.403767
`Wi-Fi`                 -4.504e+04  3.611e+04  -1.247 0.212455
Hidrofor                 1.551e+04  3.754e+04   0.413 0.679614
Jeneratör                6.466e+04  4.022e+04   1.608 0.108010
Otopark                  3.620e+03  3.139e+04   0.115 0.908216
`Ses Yalitimi`           1.325e+04  3.176e+04   0.417 0.676645
`Su Deposu`              3.149e+04  3.593e+04   0.877 0.380817
Cami                    -7.882e+04  4.203e+04  -1.876 0.060813 .
Kilise                   5.621e+04  4.429e+04   1.269 0.204515
Market                  -4.442e+04  5.364e+04  -0.828 0.407649
Park                     3.590e+04  3.884e+04   0.924 0.355344
`Saglik Ocagi`           2.112e+04  4.679e+04   0.451 0.651778
`Semt Pazari`           -7.069e+04  4.379e+04  -1.614 0.106543
Sauna                    2.789e+04  5.311e+04   0.525 0.599491
`Spor Salonu`           -5.249e+04  3.349e+04  -1.567 0.117194
`Tenis Kortu`            4.304e+04  5.482e+04   0.785 0.432419
---
Signif. codes:  0 ‘***’ 0.001 ‘**’ 0.01 ‘*’ 0.05 ‘.’ 0.1 ‘ ’ 1

Residual standard error: 679000 on 2862 degrees of freedom
Multiple R-squared:  0.5908,    Adjusted R-squared:  0.5791
F-statistic: 50.39 on 82 and 2862 DF,  p-value: < 2.2e-16
First 20 predictions:
        V1      pred
1  1200000  881787.6
2  1100000  862002.8
3   245000  339582.8
4  1890000 2160635.7
5  1360000 1036269.9
6  2400000 3067823.0
7  1280000  926335.9
8   575000  411630.6
9   390000  706514.2
10 1300000 1140435.6
11  460000  677953.1
12  920000 1287126.6
13  850000 1614840.1
14 1200000  166346.9
15 1500000 1172148.9
16 1200000  393769.3
17 3000000 1157697.3
18 1500000 1082589.2
19  490000  561175.0
20 3350000 3212890.7
-
$\begingroup$ Very thanks for your recommendations. I dropped down the indicators with no variation but I don't understand why we need to do last two steps, adding polynomials and logarithm. Would you mind explaining? $\endgroup$ Commented May 23, 2019 at 9:25
-
$\begingroup$ When you add non-linear features (x^2 or log(x)) you can often achieve a better fit to the data. Recall that you impose a functional form in OLS. It is linear if y = a + b x. However, if your x has a non-linear pattern you can add y = a + b x + c x^2 (or whatever function) to improve the fit. You can play with different functional forms. In my app posted above, I added x+x^2+...+x^10. Its the "poly" thing in R. You really should have a good look in a proper textbook if you are not familiar with this aspects of basic regression. Its important to understand that. $\endgroup$– PeterCommented May 23, 2019 at 9:41
-
$\begingroup$ thank you very much. Is there mean absolute error output in your code I couldn't see $\endgroup$ Commented May 23, 2019 at 10:17
-
$\begingroup$ no its in the text just before the output $\endgroup$– PeterCommented May 23, 2019 at 10:42
-
$\begingroup$ sir could you glance at the question? --> datascience.stackexchange.com/questions/52789/… $\endgroup$ Commented May 28, 2019 at 21:04


