0
$\begingroup$

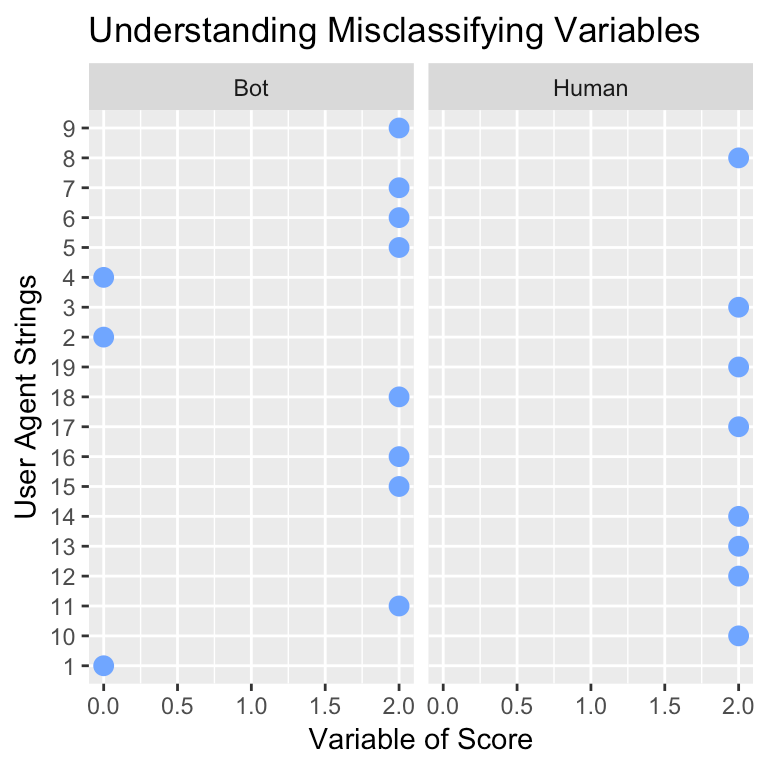
I am currently attempting to output some data based on user agent strings. The strings are too messy to place into a plot similar to the one shown below, so I plotted their index instead. Why is my plot outputting out of order? I would like to have my $y$-axis be in ascending order.

For context, I am plotting 6 plots with a for loop and none of them are producing the y-axis in order.

Edit: I added 'uas_id' dplyr code with solution.

enter image description here

gbuas_large<-gbuas_large%>%
              mutate(uas_id = sort(strtoi(rownames(gbuas_large))))%>%
              select(user_agent_string,uas_id,everything())

col<-names(gbuas_focus[,5:10])

for(i in col) {
  print(i)
  ua_p<-ggplot(gbuas_focus
              )+
    geom_point(aes_string(
                x=i,
                y='uas_id'),
                color="#70a6ff",
                size=3
               )+
    labs(x='Variable of Score',
         y='User Agent Strings',
         title="Understanding Misclassifying Variables"
        )+
    facet_wrap(~classification)
    print(ua_p)
}
$\endgroup$

1 Answer 1

1
$\begingroup$

It is in order, but not in the order that you want.

It is currently treating the indices as a string.

To get your desired index as numerics, here are some codes that hopefully can help you.

> c = c("1", "2", "13")
> c = sort(c)
> c
[1] "1"  "13" "2" 
> c = strtoi(c)
> c
[1]  1 13  2
> sort(c)
[1]  1  2 13
$\endgroup$
2
  • $\begingroup$ I edited my post. $\endgroup$
    – Slyme
    Commented Jun 12, 2019 at 14:38
  • $\begingroup$ Thank you for your suggestion. I was able to modify my code to get the desired output. $\endgroup$
    – Slyme
    Commented Jun 12, 2019 at 15:17

Your Answer

By clicking “Post Your Answer”, you agree to our terms of service and acknowledge you have read our privacy policy.

Not the answer you're looking for? Browse other questions tagged or ask your own question.