0
$\begingroup$

Question

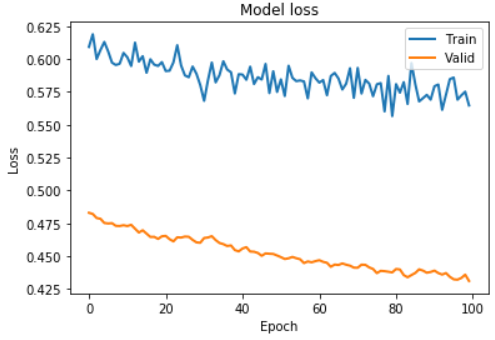
  1. Why such a big difference between my 'Train loss' and 'Validation loss' as shown in the picture below? Is it a signal that my codes are wrong and my trained network is wrong as well?

enter image description here

  1. Some of my codes are as follows:
DATA_SPLIT_PCT = 0.2

timesteps =  5
n_features =  20

epochs = 100
batch = 32
lr = 0.0001

lstm_autoencoder = Sequential([
    # Encoder
    LSTM(8, activation='relu', input_shape=(timesteps, n_features), return_sequences=True),
    LSTM(4, activation='relu', return_sequences=False),
    RepeatVector(timesteps),

    # Decoder
    LSTM(4, activation='relu', return_sequences=True),
    LSTM(8, activation='relu', return_sequences=True)
    TimeDistributed(Dense(n_features)),
])

adam = optimizers.Adam(lr)
lstm_autoencoder.compile(loss='mse', optimizer=adam)

for stock in stock_list:  # 500 stocks in stock_list
    lstm_autoencoder_history = lstm_autoencoder.fit(X_train_dict[ticker], X_train_dict[ticker], 
                                                    epochs=epochs, 
                                                    batch_size=batch, 
                                                    validation_data=(X_valid_dict[ticker], X_valid_dict[ticker]),
                                                    verbose=False).history

plt.plot(lstm_autoencoder_history['loss'], linewidth=2, label='Train')
plt.plot(lstm_autoencoder_history['val_loss'], linewidth=2, label='Valid')
plt.show()
  1. I used the for loop to feed my data into lstm_autoencoder network. In the dictionary variable stock_list, there are 500 stock names such as 'AAPL'.

  2. I plotted lstm_autoencoder_history['loss'] and lstm_autoencoder_history['val_loss'] and it is weird because usually validation loss is higher than train loss.

  3. I am curious to know why my plot has smaller amount of validation loss. For your information, I used Keras as my deep learning framework. And since I used Keras, I thought this library would handle the different proportion of training set size and validation set size by averaging the errors.

$\endgroup$
1
  • $\begingroup$ The curves you show are typical of underfit, so maybe this is the problem. Take a look here: > machinelearningmastery.com/… $\endgroup$
    – pairon
    Commented Apr 16, 2020 at 15:55

1 Answer 1

1
$\begingroup$

I think this is because your training set is much larger than your validation set. What this means is that for training; losses are being accumulated for comparatively larger number of examples than validation. Hence your training error is larger than your validation error.

I don't think its a problem with your code. If you see closely the trend line has almost same slope for both training loss and validation loss; this suggests that you are okay as far as code is concerned.

$\endgroup$
4
  • $\begingroup$ This would mean the losses are not averaged over the samples/batches and therefore not comparable. Is this really true? $\endgroup$
    – Feodoran
    Commented Feb 1, 2020 at 9:09
  • $\begingroup$ I think this is incorrect. The loss is MSE, which has divides total error by the number of observations. $\endgroup$
    – Dave
    Commented Apr 16, 2020 at 16:03
  • 1
    $\begingroup$ Keras averages loss over batches @Feodoran. I don't think the magnitude of training and validation losses is ever directly compared. My understanding of it is you always see the trend and not the absolute values when comparing training and validation losses. Does that seem correct? $\endgroup$ Commented Apr 16, 2020 at 17:11
  • $\begingroup$ This has complete explanation. I was going for the third reason I think $\endgroup$ Commented Apr 16, 2020 at 17:19

Your Answer

By clicking “Post Your Answer”, you agree to our terms of service and acknowledge you have read our privacy policy.

Not the answer you're looking for? Browse other questions tagged or ask your own question.