1
$\begingroup$

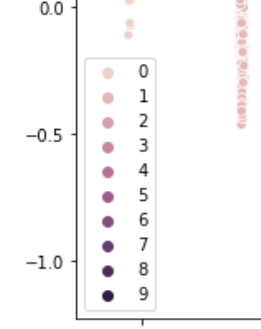
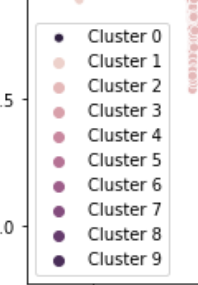
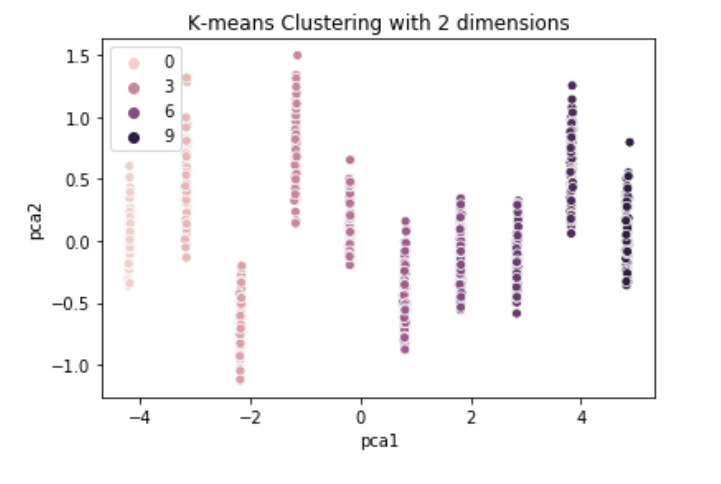
How can I change the legend as we can see now the legend has some cluster numbers missing. How can I adjust the legend so that it can show all the cluster numbers (such as Cluster 1, Cluster 2 etc, no it's only 0 3 6 9)? (codes I followed this link: Perform k-means clustering over multiple columns)

kmeans = KMeans(n_clusters=10)
y2 = kmeans.fit_predict(scaled_data)

reduced_scaled_data = PCA(n_components=2).fit_transform(scaled_data)
results = pd.DataFrame(reduced_scaled_data,columns=['pca1','pca2'])
sns.scatterplot(x="pca1", y="pca2", hue=y2, data=results)
#y2 is my cluster number

plt.title('K-means Clustering with 2 dimensions')
plt.show()

enter image description here

Edit: the legend seem not the same, the cluster 0 should be the lightest color.

enter image description here

enter image description here

$\endgroup$

1 Answer 1

1
$\begingroup$

Yeah this is an annoying weirdness of seaborn. Just pass legend='full' as a parameter to sns.scatterplot(). So your code becomes:

kmeans = KMeans(n_clusters=10)
y2 = kmeans.fit_predict(scaled_data)

reduced_scaled_data = PCA(n_components=2).fit_transform(scaled_data)
results = pd.DataFrame(reduced_scaled_data,columns=['pca1','pca2'])
sns.scatterplot(x="pca1", y="pca2", hue=y2, data=results, legend='full')
#y2 is my cluster number

plt.title('K-means Clustering with 2 dimensions')
plt.show()

I have no idea why you'd ever want half a legend! But the parameter defaults to 'brief'. Refer to the seaborn documentation:

legend : “brief”, “full”, or False, optional

How to draw the legend. If “brief”, numeric hue and size variables will be represented with a sample of evenly spaced values. If “full”, every group will get an entry in the legend. If False, no legend data is added and no legend is drawn.

edit: To have the clusters named in the format you're after, first create a list in the right format, and then call plt.legend() and pass that list as an argument to legend():

legend = []
for i in np.unique(y2):
    legend.append('Cluster {0}'.format(i))

sns.scatterplot(x="pca1", y="pca2", hue=y2, data=results, legend='full')
#y2 is my cluster number

plt.title('K-means Clustering with 2 dimensions')
plt.legend(legend)
plt.show()

To change the location of the legend, use the loc= parameter in the plt.legend() call. For example plt.legend(legend, loc='upper right') or plt.legend(legend, loc='upper left')

$\endgroup$
7
  • $\begingroup$ Hi thanks now I get all the cluster number, but I want to custom them from '0,1,2,3...'to 'Cluster 0, Cluster 1...', and also the legend covers part of the plot, I might need to make the plot bigger, do you mind giving me some hints? Thanks again. Note that y2=[0,1,2,3...] @DanScally $\endgroup$
    – Cecilia
    Commented Aug 2, 2019 at 8:21
  • $\begingroup$ @Cecilia that's reasonably easy too; see my edit. $\endgroup$
    – Dan Scally
    Commented Aug 2, 2019 at 8:25
  • $\begingroup$ Hi thank you soooo much! But now the legend is too large and cover my data points, I tried to change 'size_norm' but nothing happened, is there a way that I can make the legend smaller or make the whole plot larger? $\endgroup$
    – Cecilia
    Commented Aug 2, 2019 at 8:33
  • $\begingroup$ @Cecilia you can use the loc parameter when calling plt.legend() to control where it goes. Passing plt.legend(legend, loc='best') will make it try to deconflict. Alternatively you can call fig = plt.figure(figsize=(36,12)) BEFORE sns.scatterplot() to change the size of the whole plot. There might also be a way to control the size of the legend itself; try the plt.legend() documentation: matplotlib.org/3.1.1/api/_as_gen/matplotlib.pyplot.legend.html $\endgroup$
    – Dan Scally
    Commented Aug 2, 2019 at 8:36
  • $\begingroup$ Thank you so much, I've solved it, but I compared the adjusted legend, the first cluster-Cluster 0 should be the one with the lightest colour, but it's the darkest one now, not sure why this happens, please see my edit. Thanks again. $\endgroup$
    – Cecilia
    Commented Aug 2, 2019 at 8:43

Your Answer

By clicking “Post Your Answer”, you agree to our terms of service and acknowledge you have read our privacy policy.

Not the answer you're looking for? Browse other questions tagged or ask your own question.